Understanding e-Waste Management in Developing Countries

Organisations are the largest consumers of ICTs and the largest producers of e-waste.  But what shapes their e-waste decisions?  Why do some recycle, others donate, and others dispose?

To understand this, research in the Centre for Development Informatics by Loga Subramanian first categorised four different e-waste strategies:

  • Indifferent: the organisation does not adopt any strategic position in relation to e-waste.
  • Reactive: the organisation adopts the minimum e-waste strategy necessary to react to its context.
  • Proactive: the organisation pushes its e-waste strategy ahead of the basic reactive minimum.
  • Innovative: the organisation sees e-waste as an opportunity and adopts an innovative strategy in order to address that opportunity.

eWaste Strategies

To explain these differences, a six-factor model was developed of e-waste strategy determinants.  Key external determinants were:

  • Government regulation: in particular the threat of fines and other costs associated with non-compliance with environmental regulations.
  • Peer pressure: especially where there is some form of sectoral association.
  • Client requirements: where these include a need for particular environmental standards or actions.
  • Corporate reputation/brand image: given environmental actions are seen to directly correlate to image and reputation.

Key internal determinants were:

  • Financial impact: the financial implications of e-waste decisions.
  • Organisational culture/leadership: the complex of values, beliefs, assumptions and symbols which organisational leaders promote and which shape all decisions and actions.

eWaste Strategy Determinants

Applying this model to India’s largest e-waste producer – the ICT sector – Loga found a significant difference in strategies between different organisations:

  • Very large firms adopted a proactive strategy, driven by significant internal and external pressures that reflected their position within global value chains.
  • By contrast, ICT sector SMEs were largely indifferent to e-waste, felt few external pressures due to their position within localised value chains, and typically used informal channels that produced some financial return on their scrap ICT.

Given these insights, what are the policy implications?  Current legislative approaches – transferred from the global North and based on the principle of extended producer responsibility – are unlikely to help.  e-Waste recyclers must be brought into the legislative and financial equation.  SMEs must be placed within the purview of legislation (they are currently exempt), and SME associations must place e-waste onto their agenda.

If you would like to know more, please refer to the journal article reporting this research, published in the journal, Information Technology for Development and available via open access: “Understanding e-Waste Management in Developing Countries”.

Digital Dividends: Thoughts on the 2016 World Development Report

Some years back, helping run a session at the World Bank, I introduced myself to a table of participants.  “Oh yes”, came the sniffy response, “you’re the ICT failure guy”.  This was a World Bank that believed in – and heavily promoted – the development benefits of ICTs, and had little time for any contrary evidence.

Judging from this year’s World Development Report – “Digital Dividends” – that rose-tinted optimism has been replaced by a much more realistic, and somewhat downbeat, perspective on ICT4D; a perspective that’s emerged from strong engagement with the current evidence base.

Three Divides

WDR2016 is a tale of three divides.

The first is an impact divide: a gap between ICT’s widespread diffusion and its actual delivery of benefits – the “digital dividends” of the title.  As one would expect, the Report does a great job of laying out those dividends, particularly through pithy frameworks and graphics.  It shows the way in which ICT affordances of efficiency, inclusivity and innovation have driven productivity, growth and jobs in the economic sphere, and more capable and responsive governments in the political sphere.

Yet alongside the digital dividend has come:

  • a digital deficit: inequalities in the distribution of these benefits with a few “haves”, many “have nots”, and far more “have lesses”; and
  • digital ills: cybercrime and curtailment of online freedoms that sit beside the ICT4D unmentionable, online pornography.

The cause of these problems – at least the digital deficit – is the two other divides.

The digital divide is familiar territory: the problems of accessibility and affordability with customary prescriptions that mix competition and regulation, and at least a mention for the applicability problems that arise from digital illiteracy.  But of more interest is the strong recognition that a social divide is the main determinant of the pattern of ICT4D impacts: a gap between the regulations, skills, and institutions needed to deliver digital dividends for all vs. the actual regulations, skills and institutions present within developing countries.

Those who believe in a contextualised, socio-technical approach to ICT4D will nod along to all this.  Even the consequent prescriptions – “regulations that allow firms to connect and compete; skills that technology augments rather than replaces; and institutions that are capable and accountable” – while they have an expected flavour of neo-liberalism, constitute a broader digital policy agenda than often promoted in the past by the World Bank.

Digital Development

This broader agenda reflects a bigger picture issue: the Report is one more marker of the transition from “ICT4D” to “digital development”.  The absence of ICT4D (it gets no mentions save a bibliographic reference to one of my papers) in favour of digital development is more than just a change in terminology but – as I’ve written in an earlier report (see here for edited version) – reflects the slow change from ICTs being a tool that assists development to their being the platform that mediates development.

The agenda for digital development will be substantially shaped by the Sustainable Development Goals, with their three essentials of transformation, inclusion and sustainability:

  • As noted above, WDR2016 identifies how much ICTs have already delivered; how reality has so far undershot the transformative potential of ICTs, due to technical and social divides; but also what the solutions might be.
  • Inclusion – or rather lack thereof – is also a key Report theme, citing concentration of economic and political power, state and corporate control of citizens, and inequality of economic impacts. The Report’s focus on economic and political domains means it has much less to say about ICTs and inequalities in other domains such as social and family and cultural life.  It is also rather mixed in its perspective on ICTs and inclusion: at times arguing inequalities “persist, not because of digital technologies, but in spite of them”, but in other places explaining how ICTs have facilitated digital monopolies, automation of middle-income jobs, and digital authoritarianism.
  • Sustainability and its operationalisation through resilience gets a brief acknowledgement but – as I’ve noted in my “ICT4D2016” paper – much remains to be done to really get a grip on the coming e-sustainability and e-resilience agenda.

The practice of digital development will be substantially shaped by Development 2.0: the ICT-enabled innovations that challenge existing development structures and processes: users as digital producers, the power of the crowd, digital participation, network structures, data-intensive development, and open development.  In largely reviewing the existing evidence base, “Digital Dividends” has less to say about these.  But they are identifiable within the Report as part of the coming flow.

WDR1998/99 (“Knowledge for Development”) had an important impact in kick-starting ICT4D.  WDR2016 faces a different world – one far more mature, and perhaps a little jaded in its experience of ICTs and development, but it reflects this evolution well and will be a vital pointer for the “digital development” future.


Disclosure: I was an invited Advisory Panel member for WDR2016.

ICT4D’s 95:5 Rule

Should we have a “95:5 rule” for ICTs and development?

Typical consumption-related uses of ICTs touch 95% of people but make only a 5% difference to their livelihoods.  This covers “intensive” application of ICTs: their use to intensify an existing livelihood.  Examples include use of mobiles to bring market information to farmers; access to e-government at a local kiosk, substituting a journey to district headquarters; use of a website helping handicraft producers sell their goods; or use of email by a retailer in a low-income community.

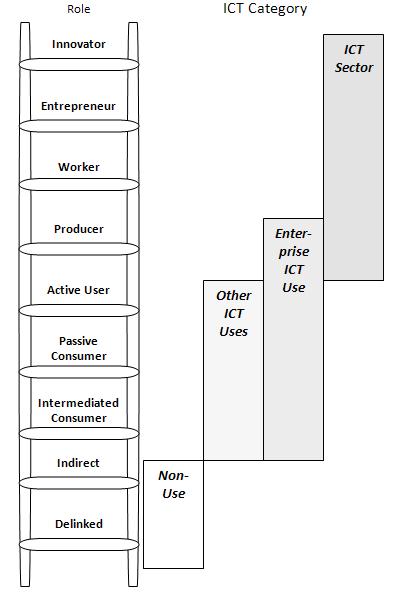
Typical production-related uses of ICTs touch 5% of people but make a 95% difference to their livelihood.  This covers “extensive” application of ICTs: their use to extend the range of possible livelihoods, by created a new ICT-based livelihood.  Examples include the umbrella people selling mobile phone calls by the street; or a worker from a poor community undertaking data entry work; or a mobile money service agent.  So extensive ICT livelihoods only exist because of ICT and they fall into the ICT sector, broadly defined.

95-5 Graphic

A classic example is the comparison of two studies from Kerala, India.  The arrival of mobile phones in one fishing area led to an average 9% increase in profits for fishermen[1].  Given 75% of income in South Indian fishing households comes from fishing[2], that suggests ICT consumption increased household income by 7% on average.  Simultaneous to this, the Keralan government was engaged in setting up an IT impact sourcing initiative, outsourcing data entry and digitisation work to groups of women from below-poverty-line families[3].  These new ICT jobs led to an average 75% increase in household income.

As with most quantitative findings, these specific figures don’t exactly match 5% or 95% but an overall average may get closer.

Let’s first take evidence on intensive use.  Consumption-related evidence sometimes reports more than a 5% income increase[4].  But this must be set against other work that shows a less than 5% income increase[5] or no increase[6] or questions the limited time-scales or scope of studies that demonstrate income increases[7].  And it must also be set against the occasional study showing an exact match: “Internet users reported an increase of US$ 51.86 in labor income … 5.01% per year”[8].

Can we say that 95% of those living in the global South are digital ICT consumers?  We are certainly close to that point.  There were just over 90 mobile subscriptions per 100 citizens in developing countries in 2014[9].  We need to bump that down to take account of individuals with multiple subscriptions but bump it up again to take account of shared access[10].  The end result will be in the neighbourhood of 95%.

Turning to evidence on extensive use, many of those working in the ICT sector derive 100% of their income from their employment.  We could shade that down overall given some with ICT-based livelihoods will have other income sources.  The proportion of those working in the ICT sector is growing but typically less than 5% (e.g. 5.7% of employment in OECD countries[11] but generally much lower in less-wealthy countries[12]).  As an example, India’s ICT sector represents less than 1% of India’s workforce[13] but that must be multiplied by three given the estimate that two-thirds of India’s ICT jobs lie outside the formal ICT sector[14].  But that estimate may exclude a number of ICT-based livelihoods, so the result may at least be heading for 5%.  It is certainly increasing year-on-year.

Given these pulls in various different directions, an endpoint of 95%:5% is not unreasonable, and certainly all the evidence points to some form of strong Pareto-type distribution.

So what?

Mathematically, 5% of 95% has the same development effect as 95% of 5%.  That means these two uses of ICTs should be given equal emphasis by governments, development agencies, development informatics researchers, ICT4D practitioners, etc.

But at present they are not.  Intensive, consumption-related ICT application is given far, far more attention.  In future that needs to be rectified, with equal emphasis given to digital inclusion by improving existing livelihoods; and to digital inclusion by creating new ICT-based livelihoods.

[1] Jensen, R. (2007) The digital provide: information (technology), market performance and welfare in the South Indian fishers sector, The Quarterly Journal of Economics, 122(3), 879-924

[2] Sivasubramaniam, K. (1991) Kattumaram Fisheries and Fisherfolk, FAO, Bay of Bengal Programme, Madras

[3] Heeks, R. & Arun, S. (2010) Social outsourcing as a development tool: the impact of outsourcing IT services to women’s social enterprises in Kerala, Journal of International Development, 22(4), 441-454

[4] E.g. Aker, J.C. (2008) Does Digital Divide or Provide? The Impact of Cell Phones on Grain Markets in Niger, BREAD Working Papers (177), Bureau for Research and Economic Analysis of Development, Duke University, Durham, NC; Rizvi, S.M.H. (2011) LifeLines: livelihood solutions through mobile technology in India, in: Strengthening Rural Livelihoods, D.J. Grimshaw & S. Kala (eds), Practical Action Publishing, Rugby, UK, 53-70

[5] E.g. May, J., Dutton, V. & Munyakazi, L. (2011) Information and Communication Technologies as an Escape from Poverty Traps, PICTURE Africa Research Project, Nairobi; cited in Diga, K. (2013) Access and usage of ICTs by the poor, in: Connecting ICTs to Development, L. Elder, H. Emdon, R. Fuchs & B. Petrazzini (eds), Anthem Press, London, 117-136

[6] E.g. Aker, J.C. & Fafchamps, M. (2013) Mobile Phone Coverage and Producer Markets: Evidence from West Africa, Discussion Paper 9491, Centre for Economic Policy Research, London, UK

[7] E.g. Srinivasan, J. & Burrell, J. (2013) Revisiting the fishers of Kerala, India, in:  ICTD2013: Proceedings of the Sixth International Conference on Information and Communication Technologies and Development, J. Donner & T. Parikh (eds), 56-66

[8] Galperin, H., Mariscal, J. & Barrantes, R. (2014) The Internet and Poverty: Opening the Black Box, IDRC, Ottawa

[9] ITU (2014) ICT-Eye, International Telecommunication Union, Geneva

[10] Heeks, R. (2009) Beyond subscriptions: actual ownerships, use and non-use of mobiles in developing countries, ICT4DBlog, 22 Mar

[11] OECD (2014) ICT Employment (indicator), OECD, Paris

[12] OECD (2011) Size of the ICTsector, in: OECD Factbook 2011-2012, OECD, Paris; EC (2012) Information and Communications Technology (ICT) Sector, EU Skills Panorama, European Commission, Brussels

[13] NSSO (2013) Key Indicators of Employment and Unemployment in India, 2011-2012, National Sample Survey Office, Government of India, New Delhi; Nasscom (2014) India IT-BPM Overview, Nasscom, New Delhi.

[14] Nandi, R. (2014) Decent work and low-end IT occupation workers in Delhi, The Journal of Social Science and Humanity Research, 2(1), 9-23

Understanding ICT4D and Capabilities via User Roles

There has been a small but substantive engagement to understand how the capability approach of Sen and others could be applied in the ICT4D field (e.g. Andersson et al 2012, Kleine 2013).  One of the key challenges is the granularity of the capability approach.  It requires us to break down development not merely to the level of individuals but to the level of single capabilities or functionings.  Thus, at least in theory, generating a list that is many billions-long.

The capabilities approach can therefore only be operationalised by aggregation: a simplification that groups capabilities into a relatively few categories (e.g. Alkire 2002), or which aggregates from the individual to the group (e.g. Thapa et al 2012).

In this blog entry, I propose a different type of aggregation, via the notion of the “roles” people play in relation to ICTs.  Developing from the concept of roles within the workplace (e.g. Biddle 1986, Huvila 2008), we can define a role as a set of tasks and behaviours that are performed by an individual.  Roles therefore represent something halfway between a realised functioning and a livelihood.  They are shaped by “a mix of both social dynamics and technological affordances” (Postigo 2011:184).

Here, a set of roles will be analysed that people can play vis-à-vis ICT; represented as a ladder, as shown in the figure below.  In simple terms, climbing the ladder could be read as a greater intensity of engagement with the technology.  It is also a ladder of technological capability; each step reflecting higher-level competencies (skills, knowledge and perhaps also attitudes) that are required for this type of ICT use but which are also created by this type of ICT use.  And it also represents Sen’s ideas, with each successive role being a greater level of realised functioning.

ICT Roles Ladder

Figure 1: Ladder of ICT-Related Roles

The various roles can be understood in relation to categories of ICT use.  These are summarised in the figure and detailed below, selecting examples of particular relevance to those in low-income communities.  For further details, see the online paper: “ICTs and Poverty Eradication: Comparing Economic, Livelihoods and Capabilities Models”.

Non-Use:

In these roles, members of poor communities are not direct users of either the technology or the information and services it carries:

  • Delinked: there is no obvious connection between particular ICT applications and poor communities.  An example might be applications within a large corporation which does not produce goods or services of relevance to poor communities.
  • Indirect: this represents a very large category of ICT applications in organisations in which the poor have no direct connection with the ICT, but in which the ICT application does deliver some benefit.  Examples might include the use of ICTs in large firms to improve supply, distribution and marketing to base-of-the-pyramid markets.

Other ICT Uses to Enterprise ICT Use:

In these roles, the poor make direct use of either the technology or the information and services it carries.  They can do this either as entrepreneurs or in other roles:

  • Intermediated consumer: this can represent all three main levels of consumption-related use of ICTs – one-way broadcast of information, interaction, transaction – but in no case is the consumer a direct ICT user; hence there is limited ICT-enabled change in role.  A typical example might be the delivery of e-government services, undertaken at kiosks and service centres staffed by intermediaries.
  • Passive consumer: a role in which there is direct use of the ICTs but just to receive “broadcast” information e.g. about health or market prices.
  • Active user: digitally-enabled interaction and transaction with socio-economic contacts; for example, the remittance of “mobile money” from urban migrants to rural relatives, or the use of telecentres by farmers to get agricultural guidance from distant advisers.

Enterprise ICT Use to ICT Sector:

In this role, those in poor communities make direct use of ICTs:

  • Producer: creation of enduring digital content.  This could be undertaken by an entrepreneur, for example, advertising goods and services on a voice-activated information service.  But it also overlaps into the ICT sector category; for example, musicians or video producers recording then sharing content on mobile phones.

ICT Sector:

In these roles, the use of ICTs is so central to the livelihood that it is seen as lying within the ICT sector:

  • Worker: employment in an ICT-based activity (one that could not exist without ICTs); for example, those employed to undertake data entry and other digitisation tasks as part of IT impact sourcing contracts.
  • Entrepreneur: creation of a self-employed ICT-based livelihood (one that could not exist without ICTs); for example, the umbrella people selling phone calls by the roadside, or those who set up PC kiosks providing digital photography, e-ticketing and e-government services.
  • Innovator: adaptation of the technology by modifying the technology itself such as the “street hacks” that alter mobiles to accept dual SIMs, or by modifying ICT-enabled processes such as the mobile money agents who adapt methods of service delivery to match their local context.

Any attempt to aggregate capabilities has its downsides, since it must necessarily simplify away some of the richness of Sen’s ideas.  However, the use of roles – whether those proposed above or others – as an analytical approach offers a fairly straightforward and robust way of evaluating ICT4D initiatives, which does some justice to the intentions and insights of the capability approach.

Further work now needs to be done to dig into the literature on work-roles, life-roles, social-roles and role theory, in order to provide a stronger foundation for the role ladder.

Development Informatics Research Must Stop Ignoring ICT’s Downsides

The dominant narrative within ICT4D associates digital technologies with positive impacts, and has tended to underplay negative impacts.  What are the implications for development informatics research?

Jessops Amazon

There has been a recent cluster of global evidence about negative impacts:

We can begin to understand this via the ICT impact/cause perspectives diagram shown below.

ICT Impact Cause Diagram

Unless we adopt an extreme perspective, we can recognise that in terms of impacts, it would have been equally easy to pull out a set of positive evidence about ICT.  But it is positive and negative together that tell the whole story.  And in terms of causes, there is no simple relationship between the technology and the impacts identified above but, instead, a socio-technical foundation.

This leads to a number of implications for the academic field of development informatics:

Balance: are we balanced enough in terms of the impacts we associate with ICTs in our work?  Pushing a largely positive narrative can have the effect of making our work seem like hype; a relentless monotone buzz to which those working in development become habituated, and start to ignore.

Preparation: are the policy makers and practitioners who use our work prepared for what’s coming?  Development informatics research needs to engage with the negative impacts, providing research users with an understanding of those impacts and, where possible, some strategies for amelioration.

Analytical Tools: do we understand what is behind these ICT trajectories?  ICTs are not the direct cause of the impacts outlined above; they are an enabler of particular economic and political interests.  Development informatics needs to ask the age-old question: cui bono?  Who benefits when high street shops close?  Who benefits from cyber-repression?  Who benefits from printed guns?  Who benefits from pornography?  Cui bono is answered by the analytical tools of political economy.  We need to be answering those questions and using these tools a whole lot more in development informatics.

Advocacy: how do we engage with ICT4D innovation trajectories?  Even as it becomes more open and more decentralised, the trajectory of innovation can still be shaped by debate, by advocacy and by activism.  Development informatics has always been an engaged area of academic endeavour, not stuck in the ivory tower.  We have often worked with those seeking to deliver the positive impacts of ICT4D.  The challenge now is to work more with those seeking to avoid the negative impacts of ICT4D.

If you see other implications, then let us know . . .

Steering e-Government Projects from Failure to Success

How do you turn a relatively unsuccessful e-government (or ICT4D) project into a relatively successful one?

There’s not a lot of guidance on this question.  Lists of success and failure factors are generic rather than specific to any one project, and need to be analysed before the project starts.  Evaluation methodologies focus more on impact than implementation, and generally apply only after the project has ended.

What is needed is a “mid-implementation toolkit”: something that will both analyse where you’ve got to in the project, and recommend an improvement action plan for the future.  Researchers working alongside an Ethiopian e-government project have recently published the results of testing just such a toolkit.

Using the “design-reality gap” framework, the researchers gathered data from four different stakeholder groups involved with the e-government project, which had introduced a land management information system into one of Ethiopia’s city administrations.  The system was only partly operational and was not yet fully integrated into city administration procedures: it could therefore be described as a partial failure.

The design-reality gap framework helps measure any differences that exist between the project’s initial design expectations and current implementation realities.  It does this along seven dimensions (see figure below).

Where large gaps are found, these highlight the key and specific problem areas for the project.  In this particular e-government initiative, significant design-reality gaps were identified in relation to:

  • Management systems and structures (a failure to set up an ICT department and to hire permanent IT staff).
  • Staffing and skills (hiring only five of the required nine IT staff, and undershooting the necessary qualifications and experience).
  • Project objectives and values (allowing some culture of corruption to remain among lower-level administrators).
  • Information systems (absence of one core system module and of digitised documents).

These gaps demonstrated that the e-government system had not yet institutionalised within the city government.  The gap analysis was therefore used as the basis for a discussion with senior managers.  From the analysis and discussion emerged two things.

First, identification of small gaps that had lain behind the partial success of the system – the commitment of project champions, process re-design being conducted prior to introduction of new technology, and stability in the information that was digitised onto the e-government system.

Second, identification of an action plan that would close the main extant gaps between design and reality: creating the proposed new ICT department, hiring additional IT staff, and setting up permanent positions with clearly defined salary scales and promotional criteria. These, in turn, would provide the basis for implementing the missing module, and scanning the missing legal documentation.

Not all the gaps can readily be closed: it will take a much longer process of cultural change before the last vestiges of corruption can be eliminated.  Nonetheless, design-reality gap analysis did prove itself to be a valuable mid-implementation tool.  It is helping steer this e-government project from partial failure to greater success.  And the authors recommend its use by e-government managers as they implement their projects: it has helped to focus management attention on key e-government project issues; it digs beyond just technical issues to address underlying human and organisational factors; and it offers a systematic and credible basis for project reporting and analysis.

Feel free to comment with your own experiences of design-reality gaps, or other mid-implementation techniques for e-government project analysis and improvement.

e-Government Benefits And Costs: Why e-Gov Raises Not Lowers Your Taxes

Often, IT companies sell e-government to politicians, and politicians sell e-government to citizens on the promise that it will save money.  These claims regularly appear as “news” items, especially in IT- or government-related media.  This has in part encouraged the huge expenditure on e-government: a ballpark figure would be US$3 trillion during the first decade of the 2000s[1].

So here’s my question: “If e-government is so great at cutting costs, how come my taxes haven’t gone down?”

Of course, taxes depend on far more variables than just e-government.  But the simple answer to the question is “. . . because e-government does not save money, it costs money”.  That seems likely the case in the global North where e-government seeks to cut costs by replacing expensive humans with cheap technology.  It is most definitely going to be the case in the global South where the technology is more expensive and the humans are much cheaper.

Despite the obvious importance of the topic, good quality cost:benefit calculations are rare but can be found.  Six years of e-government in UK local government saw £3.90 billion of investment release just £0.97 billion of savings[2].  The aggregate cost:benefit ratio of e-government projects in Australia was 1.64:1[3].

Rarer still is good quality work from developing countries.[4]  However, a recently-published study of e-government in Bhutan by Mayumi Miyata provides a model for systematic and comprehensive evaluation of e-government costs and benefits. The case study focuses on the Road Safety and Transport Authority of Bhutan, which issues driving licences and vehicle registration documents.  This was traditionally a paper-based process, and often slow; particularly for driving licences which had to be sent by post from regional offices to the head office in Thimphu.  In the mid-2000s, an Internet-enabled database system was installed so the main information associated with these processes could be passed instantly between offices.  (This was therefore an “e-administration” application for use by government staff rather than an “e-services” application for use by citizens.)

Data for Miyata’s research was gathered both before and after the introduction of this e-government system including detailed observation and timing of work processes, a breakdown of departmental accounts, and a survey of citizens.  The “after” component was undertaken in 2007; two years after implementation of the system, allowing plenty of bedding-in time.

Activity-based costing showed that the direct labour cost for issuing licences and registrations fell 24% following introduction of e-government; from US$15,080 to US$11,530 per year[5].  For example, the direct cost of issuing one driving licence fell from US$1.57 to US$1.17.  This was achieved largely through a significant redesign and decentralisation of internal decision-making and workflow.

However, introduction of e-government brought additional costs – hardware, software, internet connectivity and the cost of IT staff – totalling US$11,080 per year (set-up costs being amortised over 10 years).  The only indirect saving was in reduced postal cost (US$720).  Thus, overall costs were US$15,800 per year before e-government; US$22,610 after e-government.  A rise of 43%.

We need to recognise some specific features of this case that make it typical of a least developed country:

  • the particularly low labour costs and high IT costs;
  • the relatively low volumes of transactions across which costs can be spread (the case is more akin to a local than national government in size);
  • the use of e-administration rather than a web-based self-service system which, while still requiring human back-office intervention, would automate some processes.

Miyata’s research thus provides a model that should be replicated for a broader set of examples.

On the other hand, Miyata’s work misses out three additional reasons why e-government globally fails to deliver cost savings:

  • the relatively high rate of e-gov project failure, the costs of which must be included in any overall cost:benefit accounting[6];
  • the learning curve – often of some years – that must be traversed before e-government applications can be used efficiently and effectively[7];
  • the need for government e-services to be run in parallel with existing face-to-face, phone and postal service channels in order to bridge the digital divide and avoid excluding large sections of the population from access to government services; public e-services thus being a supplement to, not substitute for, other channels[8].

Does this mean e-government is a waste of money, and we should ask for our US$3 trillion back?  No.  What it means is that e-government is not going to save money for government and help bring taxes down.  The benefits of e-government lie elsewhere.  Again, Miyata’s paper is a good illustration:

  • External savings: the lead time from application to receipt was reduced by minutes, weeks, even months for outlying offices.  Wait times in offices may also have come down.  Other studies report shorter waits and fewer journeys.  Saving of journeys can be monetised, and saving of citizen time might be (it depends how that saving is spent).  The key cost savings of e-government may thus be external not internal: for service users not administrators.
  • Internal control and accountability: e-government provided managers with greater oversight of work processes and staff.
  • Service quality and equity: citizens reported the quality of service and the fairness of treatment improved after introduction of e-government.

Other research shows further qualitative and external benefits delivered by e-government including: greater transparency of public services; greater accountability of public servants and politicians; reduced corruption; lower costs for business; greater attraction of foreign investment[9].  Please comment to add your own examples of evidence.

So e-government may not bring your taxes down, but – if properly designed and implemented – it will bring a positive economic and social return on investment.


[1] Heeks, R.B. (2006) Managing and Implementing eGovernment, Sage, London http://books.google.com/books?id=hRzAnMulatUC&dq; WITSA (2008) Digital Planet 2008, World IT Services Association, Kuala Lumpur, Malaysia; see: http://www.witsa.org/KL08/DigitalPlanet2008_ReportTables.pdf

[2] Kable (2005) Implementing Electronic Government 4, Kable, London

[3] Foley, P. & Ghani, S. (2007) The Business Case for e-Government, paper prepared for High-Level Seminar on Measuring and Evaluating E-Government, Dubai, 12-13 March http://www.oecd.org/dataoecd/44/42/38404094.pdf

[4] There is a good study of e-government projects in India but it was unable to capture cost data, so focuses only on benefits.

[5] These are costs for issuing just over 31,000 documents.  Note this excludes the cost of materials for licences/registrations, which was the same before and after e-government.

[6] Heeks, R.B. (2006) Managing and Implementing eGovernment, Sage, London http://books.google.com/books?id=hRzAnMulatUC&dq; Gauld, R. & Goldfinch, S. (2006) Dangerous Enthusiasms: E-Government, Computer Failure and Information System Development, University of Otago Press, Dunedin, New Zealand

[7] Poostchi, M. (2003) Implementing E-government, MBA dissertation, Carleton University, Ottawa, ON

[8] Helbig, N., Gil-Garcia, J.R. & Ferro, E. (2009) Understanding the complexity of electronic government, Government Information Quarterly, 26(1), 89-97

[9] Accenture (2004) eGovernment Leadership: High Performance, Maximum Value, Accenture, Dublin; Bhatnagar, S. & Singh, N. (2010) Assessing the impact of e-government: a study of projects in India, Information Technologies and International Development, 6(2), 109-127 http://itidjournal.org/itid/article/viewFile/523/231

From Digital Divide to Digital Provide: Spillover Benefits to ICT4D Non-Users

ICTs bring benefits to those who have them and not to those who don’t. They therefore increase inequality.  Right?  Well . . . let’s see.

First question: what do you mean by “those who don’t have ICTs”?

We need something a bit more nuanced than a simple, binary digital divide, and can use instead a digital divide stack of four categories (see figure below):

Non-Users: those who have no access to either ICTs or ICT-based information and services.

Indirect Users: those who do not get hands-on themselves, but gain access to digital information and services via those who are direct users.

Shared Users: those who do not own the technology, but who directly use ICT owned by someone else (a friend, workplace, ICT business, community, etc).

Owner-Users: those who own and use the technology

Of course we would need to make transverse slices through the figure; potentially, one slice for each different type of ICT, but particularly noting many in developing countries would be in a different category level for mobiles compared to the Internet.


Second question: what’s the evidence on inequality?

It is relatively limited and often bad at differentiating which digital divide categories it’s talking about.  However, we can find three types of evidence.

The Rich Get Richer; The Poor Get Poorer: situations in which some category of user gains a benefit from ICT while non-users suffer a disbenefit.  For example, micro-producers of cloth in Nigeria who owned or had use of a mobile phone found they were gaining orders and income; micro-producers without mobile phone access found they were losing orders and income (to those who had phones). (See also work on growing costs of network exclusion.)

Development vs. Stasis: situations in which some category of user gains a benefit from ICT while non-users do not gain that benefit. For example, farmers in rural Peru who used a local telecentre were able to introduce improved agricultural practices and new crops, which increased their incomes.  Those who did not use the telecentre just continued farming in the same way as previously.

Spillover Benefits: situations in which some category of user gains a benefit from ICT while non-users also gain a (lesser) benefit.  One rather less-publicised outcome from the case of Keralan fishermen using mobile phones to check market prices is an example.  Those fishermen without mobile phones saw their profit rise by an average Rs.97 (c.US$2) per day as a result of the general improvements in market efficiency and reduced wastage which phones introduced.  This was about half the profit increase seen by phone owners and meant, even allowing for the additional costs, that returns to phone ownership were greater than those for non-ownership.  However, it was a spillover benefit to non-ICT-users.

ICT4D research on spillovers to non-users specifically has been rare, with the main interests in non-users being to understand why they are non-users; and most spillover work being done between sectors or enterprises and/or focusing on the spillover of encouraging ICT adoption rather than more immediate benefits.

This does seem to be changing, perhaps because of the growth of mobile and related to earlier work on the externalities to non-users of arrival of rural telecommunications.  Rob Jensen’s Kerala study found a second digital spillover: while fishermen’s revenues rose, the price per kg fell due to the increase in supply arising from less waste.  Fish consumers (many likely non-users) now paid less than previously thanks to the mobile-induced efficiency gains.  More directly, a study of M-PESA’s community effects in Kenya found its use providing positive financial, employment, security and capital accumulation externalities that affected both users and non-users within the community.

We also have a little evidence of spillover benefits from owner-users to indirect users:

Follow-up work with Keralan fishermen found fish workers who will only get into a boat with a mobile phone-owner due to safety concerns, with these indirect users able to benefit from the owner should the boat get into difficulties.  That paper’s author (personal email) also gives the example of an indirect user citing as a benefit being informed of – and able to curtail – his daughter’s illicit elopement via his boat owner’s phone.

– Research on farmers in Northern Ghana[1] found those who did not themselves own or use mobiles benefitting from information passed on from phone owners, including more frequent meetings with agricultural extension officers; meetings that were coordinated by phone owners.

In all these cases, owner-users are benefitting more than the lower-category users to whom benefits spill over.  That means – if you’ll forgive the pun – that in these cases ICTs are causing all boats to rise but the ICT-using boats to rise somewhat faster.  Inequality may still grow; perhaps absolutely but not relatively.

I look forward to what appears to be forthcoming work by the Global Impact Study on non-user spillovers.  However, this remains a poorly-understood and little-researched issue; one that needs a greater focus since it is central to understanding the digital divide and digital inequalities.  It also has implications for practice; suggesting ICT4D projects should promote non-user spillovers as much as they promote ICT usage.  As ever, your pointers to spillover research and practice are welcome.


[1] Smith, M. (2010) A Technology of Poverty Reduction for Non-Commercial Farmers? Mobile Phones in Rural North Ghana, BA dissertation, unpublished, University of Oxford, UK

ICT and Economic Growth: Evidence from Kenya

Do ICTs contribute to economic growth in developing countries?

In the 1980s, Robert Solow triggered the idea of a productivity paradox, saying “You can see the computer age everywhere but in the productivity statistics.”  And for many years there was a similar developing country growth paradox: that you could increasingly see ICTs in developing countries except in the economic growth data.

That is still largely true of computers and to some extent the Internet, but much less true overall as mobiles have become the dominant form of ICTs in development.  In particular key studies such as those by Waverman et al (2005), Lee et al (2009), and Qiang (2009) have demonstrated a clear connection between mobiles and economic growth and/or between telecoms more generally and economic growth.  They all address the “endogeneity” problem: that a correlation between telecoms (indeed, all ICTs) and economic growth is readily demonstrable; but that you then have to tease out the direction of causality: economic growth of course causes increased levels of ICTs in a country (we buy more tech as we get richer); you need to try to control for that, and separate out the interesting bit: the extent to which the technology causes economic growth. 

The studies try to do this and show ICT investments cause economic growth, but they are all multi-country and provide no specific insights into the experiences of a particular developing nation.  If you know of such data, do please contribute.  Meanwhile, a recent edition of “Kenya Economic Update” provides an example.  Some overall points:

  • The ICT sector grew at an average of nearly 20% per year from 1999-2009 (by contrast, Kenya’s largest economic sector – agriculture – shrank by an annual average of nearly 2% per year).
  • The number of phone subscriptions has grown from the equivalent of one per 1,000 adults in 1999 to the equivalent of nearly one per adult in 2010; Internet usage rates for 2010 were around four per ten adults.
  • Person-to-person mobile money transactions at the end of 2010 were equivalent to around 20% of GDP with two of every three Kenyan adults being users.

But the report’s strongest claim is this: “ICT has been the main driver of Kenya’s economic growth over the last decade. … Since 2000, Kenya’s economy grew at an average of 3.7 percent. Without ICT, growth would have been a lackluster 2.8 percent—similar to the populaton growth rate—and income per capita would have stagnated”.  So ICTs were responsible for 0.9 of the 3.7% annual GDP growth, and for all of Kenya’s GDP per capita growth.  Put another way, ICTs were responsible for roughly one-quarter of Kenya’s GDP growth during the first decade of the 21st century.

Other nuggets from the report and from original World Bank data underlying the report:

  • The “ICT sector” is actually the “posts and telecommunications” sector.  Comparing figures from Research ICT Africa for mobile + fixed line + Internet/data services with those for the overall sector suggests that ICTs form by far the majority (likely greater than 90%) of that sector.  For the ICT part of the sector, latest figures for 08/09 show mobile takes a 54.8% share, fixed line takes 39.5%, with 1.8% for Internet services and 3.8% for data services (not 100% due to rounding).
  • The ICT sector in 2009 still represented only 5% of total Kenyan GDP (compared to 21% for agriculture/forestry), and growth has been volatile, at least as based on the recorded figures, ranging from 3.5% per year up to 66% per year during the first part of the decade, and from 7.9% to over 30% during the second part of the decade.  Only tourism (hotels/restaurants) was more volatile.  In six of the ten years of the 2000-2009 decade, though, ICT was Kenya’s fastest growing sector.
  • In the first half of the decade, annual investments in mobile were higher than annual revenues; but the ratio has subsequently slipped to investment averaging around half of revenue.  Investments in mobile during 2001/02 to 2009/10 are estimated at US$3.2bn (c.KSh250bn) and US$3bn in fixed phone services, with broadband, Internet and BPO investments adding perhaps another US$1bn.
  • The ICT sector provided a more than six-times-greater contribution to Kenyan GDP in 2009 compared to 1999.  Directly, the ICT sector contributed to 14% of the country’s GDP growth between 2000 and 2009 (at constant (i.e. not actual/current but accounting for inflation) prices, it grew from KSh13.7bn in 2000 to KSh71.8bn in 2009; GDP overall grew from KSh976bn to KSh1.382tn).  So the World Bank’s calculation that ICTs contributed a quarter of GDP growth during the decade also include a specific, quantified assumption about ICTs triggering growth in other sectors, in particular the financial sector.
  • Employment in the ICT sector is estimated to be around 100,000 in 2011 (c. 0.7% of the estimated 14m overall labour force).  But ICT punches above its weight in other ways: changes in mobile prices at the start of 2011 were credited with both causing the Kenyan inflation rate to drop and with potentially derailing government constitutional talks due to the substantial knock-on effects in causing tax revenues to drop since phone companies now contribute such a significant proportion of government income.

So, overall, what do we have here?  Some fairly solid evidence that ICT sector growth (predominantly due to mobiles) is making an important direct contribution to economic growth in this developing country.  And some less clear evidence that the indirect GDP growth effect of ICTs may nearly double this.  Thanks to mobile money, Kenya has seen a particularly strong take-up and economic role for ICTs, but it is fairly typical in terms of mobile investment, revenues, subscriber base, employment, etc.  In that case, it’s not too much of an extrapolation to expect that ICTs will have contributed something like one quarter of GDP growth in many developing countries during the first decade of the 21st century.  Evidence of ICT impact that development strategists and practitioners should be more aware of.

The ICT4D Value Chain

ICT4D projects and policies can best be understood through a value chain model.  As shown in Figure 1 below, this builds on a standard input—process—output model to create a sequence of linked ICT-for-development resources and processes.  The model can be used for projects and policies in various ways: to trace their history; to analyse their content; to assess and evaluate.

The ICT4D value chain offers four main domains that can be the focus for historical or content analysis or evaluation:

  • Readiness: the systemic prerequisites for any ICT4D initiative; both the foundational precursors that we might conceptualise mainly at the national level such as ICT infrastructure, skills and policy; and the more specific inputs (both ‘hard’ and ‘soft’) that feed into any individual initiative.  Assessment could focus on the presence/absence of these resources and capabilities, or the strategy that converts precursors into inputs.
  • Availability: implementation of an ICT4D initiative turns the inputs into a set of tangible ICT deliverables; typical among which might be a telecentre or mobile phones.  Again, assessment can focus on either the delivered resources and/or the delivery process.
  • Uptake: the processes by which access to the technology is turned into actual usage; also noting that key concerns around this process and its ability to contribute to development have related to the sustainability of this use over time, and – for various innovations that are prototyped – the potential or actuality of scaling-up.  In practice, usage indicators are more often assessed than the various uptake processes.
  • Impact: which can be divided into three sub-elements:
    • Outputs: the micro-level behavioural changes associated with technology use.
    • Outcomes: the wider costs and benefits associated with ICT.
    • Development Impacts: the contribution of the ICT to broader development goals.

Figure 1: The ICT4D Value Chain


How has interest in these four domains changed over time?

One way to trace this is through key staging posts for the ICT4D community:

  • The Digital Opportunity Taskforce (DOTForce) arose from the 2000 G8 summit in Okinawa.  In 2001, it produced its “Digital Opportunities for All” report which encompassed four focal areas.  Three – readiness, connectivity and human capacity – were related only to the Readiness domain; and one – participation in e-networks – looked mainly at Readiness and Availability issues.
  • In 2003, the first World Summit on the Information Society was held in Geneva.  Its main report was, tellingly, entitled “Building the Information Society” and not surprisingly the main focus was on building ICT connection and access; again looking mostly at the Readiness and Availability domains.
  • The second World Summit on the Information Society was held in Tunis in 2005.  Unlike its predecessor, its agenda did start to talk about impact.  It still had a strong focus on precursors like financing and governance, but it included additional discussion about the application of ICTs, thus starting to encompass the Uptake and Impact domains.
  • The largest subsequent meeting was the GK3 event in Kuala Lumpur at the end of 2007.  It was shaped by twelve main sub-themes.  Analysing these shows a fairly even spread across the four domains, though with Impact by now the largest single focus, followed by Availability.

There has been no subsequent comparable single event in the area drawing together many thousands of participants as these staging posts did; rather, a growing number of smaller events drawing several hundreds.  However, a useful bellwether is the Information and Communications for Development Report produced by the World Bank.  In its 2009 edition, the ratio of mentions of ‘readiness’ to ‘impact’ was 1:35.

Such evidence is best seen as straws in the wind rather than definitive, but it does suggest a similar pattern to that seen in other areas of ICT application, and summarised in Figure 2.

Figure 2: Changing Focus of ICT4D Priorities Over Time


Whatever the exact shape of the graph, it reflects the relative lack of attention that has been paid to ICTs’ contribution to development until quite recently.  That is problematic because, as you move from left to right along the value chain, assessment becomes more difficult, more costly but also more valuable.  Of course there has been literature assessing the connection to development including the summary Compendium on Impact Assessment of ICT4D Projects, and the 2010 Journal of International Development policy arena: “Do Information and Communication Technologies (ICTs) Contribute to Development?“.

However, donor agencies, governments, academic departments and others must still do more to shift the focus of attention along the ICT4D value chain; and to demonstrate ICTs’ development impact.