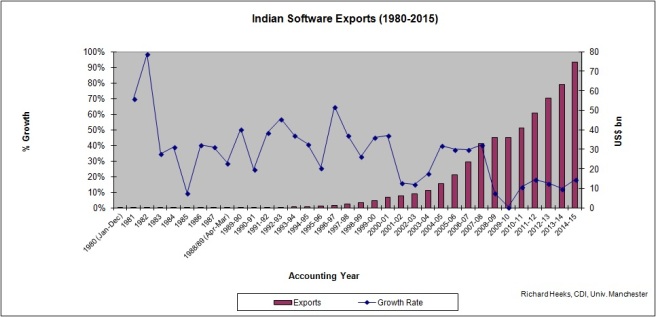
The spreadsheet linked below provides time-series data for India’s IT industry, updating data from an earlier blog entry on Indian IT data to 2009. Software export figures run from 1980; overall IT outputs from 1991; and detailed breakdown from 1998 including BPO (business process outsourcing) data from 2000. Data from 2009/10 uses a different source, so changes from 2008/09 to 2009/10 are not reliable.
– Link to XLS version of Indian IT data via Google docs
Main headlines:
a) Indian Software Exports
a1) Indian software exports are huge – roughly US$75bn in 2014/15 (and c.US$100bn if BPO services are included) – and continuously registering double digit annual growth.
a2) But the overall pattern of growth is slowing: the ten-year annual growth average was c.40% in 2002; c.30% in 2008; c.20% in 2014.
a3) IT software/services’ share of total exports remains roughly static: it was just under 14% in 2003/04 and just under 15% in 2013/14[1].
a4) Market diversification for Indian software remains limited. In the early 1990s, export destinations were: US (c.60-65%), UK (c.10%), other Europe (c.10%), Aus/NZ (c.5-10%), Asia (c.0-3%)[2]. Twenty years later in 2013-14, export destinations were: North America (63%), UK (13%), other Europe (11%), Aus/NZ (4%), Asia (6%)[3].
a5) Location of production has changed. In the early 1990s, 75% of work took place on-site, 25% in India[4]. By 2013/14, it was said that 20% of work took place on-site, 80% in India[5]. This means that net foreign exchange earnings will have risen as a proportion of gross since offshore work requires much less foreign exchange outflow than on-site working.
a6) One source[6] claims that productivity (as measured by average revenue per employee) in the Indian software sector has risen from c.US$7,000 per head in the mid-1990s, to c.US$16,000 in the late 1990s, to US$38,000 in 2014. But my own data[7] gives a completely different picture: that productivity in the 1990s was static at just over US$30,000 per head, and thus has risen very little during the 2000s: at best by 1-2 percentage points per year.
b) Domestic IT Production
b1) Although the Indian domestic IT market is large and growing, production for exports is growing faster than production for the domestic market. As a result, the share of exports in total IT output has risen from 19% in 1991/92 to 49% in 2000/01 to 67% in 2007/08 to 81% in 2014/15.
b2) IT production for the Indian domestic market and domestic IT consumption are very different. For example, domestic computer hardware production in 2013/14 was roughly US$3bn. But domestic IT consumption was US$12.4bn[8]. In part, this may be because the two figures are counting different things (e.g. consumption figure includes peripherals, network kit, storage, etc). But it likely also points to a high – and said to be growing – share of imports in Indian domestic IT consumption.
c) IT Sector Overall
c1) The IT sector overall in India represents just over 5% of GDP in 2014/15.
Follow @CDIManchester
[1] Mani, S. (2014) Emergence of India as the world leader in computer and information services, Economic & Political Weekly, XLIX(49), 51-61
[2] Heeks, R. (1996) India’s Software Industry, Sage, New Delhi
[3] ESC (2014) Computer Software/Services and ITeS Exports, Electronics and Computer Software Export Promotion Council, New Delhi www.escindia.in/uploads/SOFT1415.pdf
[4] Heeks (ibid.)
[5] RBI (2015) Survey on Computer Software & Information Technology Enabled Services Exports: 2013-14, Reserve Bank of India, New Delhi https://rbi.org.in/scripts/BS_ViewBulletin.aspx?Id=15452
[6] Malik, A. & Nilakant, V. (2015) Context and evolution of the Indian IT industry, in: Business Models and People Management in the Indian IT Industry, A. Malik & C. Rowley (eds), Routledge, Abingdon, UK, 15-34
[7] Heeks (ibid.)
[8] Chawla, M. (2014) Indian IT hardware markets stands at $12.43bn, The Economic Times, 25 Jun http://articles.economictimes.indiatimes.com/2014-06-25/news/50856134_1_anwar-shirpurwala-biswapriya-bhattacharjee-indian-it


