Global ICT Statistics on Internet Usage, Mobile, Broadband: 1998-2009

How are ICT diffusion rates changing over time in different parts of the world?  The graphs below present ITU statistics for mobile, internet and broadband, dividing countries into quintiles by GDP per capita levels, and weighting the calculated averages within each quintile by population.  They extend earlier data visualisations using Google motion chart for mobile phone and broadband penetration.
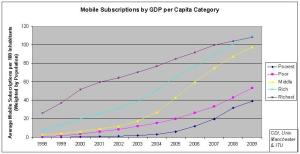
Mobile: a real sense of catch-up by the “rich” and “middle-income” countries during the mid-2000s, the former now having higher subscription rates than the “richest” countries due largely to the USA’s sub-100-per-100 statistics.  Catch-up is only just starting to happen for the poorer countries, and there’s a reminder that “mobiles are everywhere” isn’t true yet: e.g. we’ve all heard of Pakistan’s amazing growth rates but the next largest country in the bottom category is Ethiopia whose 80m citizens register less than five subscriptions per 100 people.  For fans of diffusion theory, some clear S-curve shapes on view, though a slightly worrisome dip in growth rates for the poorest countries from ’08 to ’09.  (For notes on converting mobile subscription rates to actual ownership and use rates in developing countries: see this earlier blog entry.)
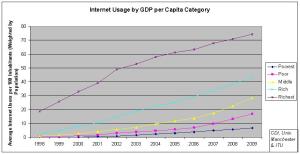
Internet: still a significant gap between the richest countries and all the rest, which have a mix of larger-country stars (VietNam, China) that punch above their category averages, and dogs (South Africa, India) that fall well below.  Due to spillover effects – e.g. an Internet user passing on web-based information to a non-user – the impact of the Internet is well above what these raw figures indicate.  And poor/middle-income countries will pass the 50 users per 100 marker in just a few years.  Growth rates in the poorest countries are strong – around 25% per year – but their low base means progress is slow.
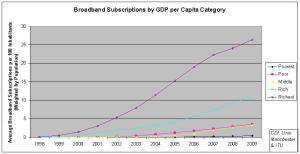
Broadband: if the Internet figures are a little salutary, then the broadband stats are more so, with the poorest countries barely figuring.  Mobiles are helping to create Development 2.0 – the ICT-enabled transformation of development processes and structures, but broadband will also be key, and it looks a very long way off for the world’s poor.  (Note poor countries average above middle-income due to China’s aggressive broadband roll-out policy, though are held back by India’s pitiful penetration rates of roughly two-thirds of a subscription per 100 people.  Middle-income countries look likely to overtake in the next year or so.)

Global Digital Gap and Digital Lag
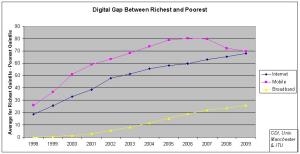
One way to summarise the situation is to look at the difference between the poorest and richest quintile countries.  As the graph shows, the “digital gap” between average penetration rates has grown and grown during the 2000s for Internet and broadband.  For mobile it began to close from 2006 onwards, but still remains very high.

You can also measure “digital lag“: the time gap between a given average ICT penetration level in the poorest countries, and the year that was achieved in the richest countries.

Current digital lag is just under 10 years for mobile, and something like 14-15 years for Internet.  For broadband, it’s just over 10 years but the figures are so low that this may not be meaningful.
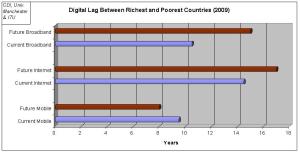
Future digital lag can be calculated by projecting growth in the poorest countries, assuming current growth rates (averaged 2004-2009) continue.  For mobile, it will be 2011 before the poorest countries reach the 75 subscriptions per 100 level that the richest countries were at in 2004; a digital lag of 7 years (though that rises to 2013 and 9 years if you extrapolate from just 2008-to-2009 growth rates).

For Internet, it will be 2019 before the poorest countries reach the 50 users per 100 level that the richest countries were at in 2002; a digital lag of 17 years.  For broadband, it will be 2020 before the poorest countries reach the 15 users per 100 level that the richest countries were at in 2005; a digital lag of 15 years (but with a wide margin for error, and calculated only on 2008-to-2009 growth rates).  Put another way, there are no signs yet of the digital lag for Internet or broadband closing over time, and not much evidence for the idea that digital lag is shortening with each new ICT innovation.

I’m sure there are other conclusions to be drawn from the data – do please go ahead.  All of the original data is available from the following spreadsheet: https://docs.google.com/leaf?id=0B-14eY3gwnmGYjVkYjIxYTQtMjQxNy00OTIxLWFlN2YtNDIwZWYzYWZlZjVk&hl=en_GB [you’ll need to log in to Google in order to guarantee access]
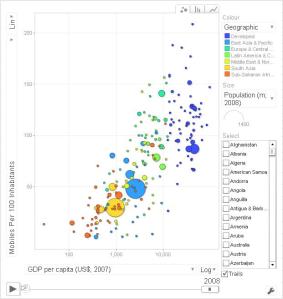
Mobile Phone Penetration: Google Motion Chart Data Visualisation

I’ve entered the ITU data on mobile phone penetration for all countries from 1998-2008 into a Google Docs spreadsheet, and then added the Motion Chart visualiser (the same engine made famous by Hans Rosling and TED, though they use the Gapminder Trendalyzer version).

Unfortunately, WordPress scripting rules mean I can’t post the active chart here. To access the spreadsheet data and Google Motion chart, you need to go to:

http://spreadsheets.google.com/pub?key=tUzZsw5SoG_jXRDl6p8tRCg&single=true&gid=0&output=html

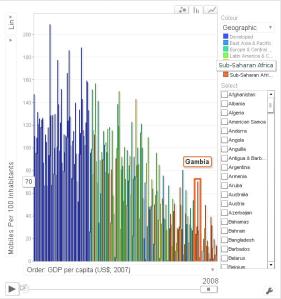
Screenshots below give an indicator of how you can visualise the data. The chart offers three main means to visualise (bubble, bar chart, and line graph) via tabs at the top right. You can change the axes and element colouring/size, and highlight individual countries. For bubble and bar, the main point of the chart is that you can click play (bottom left) and show how things change over time. (Note playback speed variation control, and also the ability to drag over and zoom in on parts of the chart.)

Not sure it adds a lot of analytic value but it’s engaging, helps give a sense of some overall trends, and identifies some interesting outliers. (Some older PCs and low-bandwidth connections will struggle to display.) I’ll repeat for other ITU data in later posts (e.g. broadband data visualisation here). You can find similar visualisation for mobile, Internet and a host of other development data at: http://devdata.worldbank.org/DataVisualizer (though currently up to 2007 only, no obvious access to underlying data, and the mobile data display doesn’t seem to work properly).  And, finally, on a separate blog entry you can find a set of rough converters to change mobile phone subscription data to data on ownership, access, use and non-use.

Can Mobile Phones Bring Financial Services to Africa’s Poorest?

Since MTN’s Mobile Money service was introduced in Uganda in March 2009, other network service providers – Uganda Telecom and Zain – have entered the market with similar money transfer products.  In the opinion of Richard Mwami, MTN’s Mobile Money head, “mobile phones have created a new battleground for banking”.  There is a strong belief that new services can transform the way in which the ordinary citizens of Uganda conduct their monetary transfers and payments.

MTN had 40,000 service subscribers by June 2009, with a relatively low average value for each transfer of US$35. A large proportion of these have been conducted ‘up-country’ outside of the capital city – Kampala; evidence that the service is attracting less well-off clients.  The true impact has yet to be empirically demonstrated.  However, a recent Working Paper from the University of Manchester’s Centre for Development Informatics provides some pointers to areas of potential and also possible constraints.  Given Uganda’s reflection of broader patterns in both financial services and mobile usage, this should also tell us something about the situation in other African nations.

The paper shows participation in financial services in Uganda falls into four categories:

  • Those who access and make use of the formal banking sector and who may hold deposit or savings accounts (18% of the adult population).
  • Those who access semi-formal micro-finance institutions or savings and credit co-ops (3% of the adult population).
  • Those who participate in informal sector financial services – ROSCAs (Rotating Savings and Credit Associations), ASCAs (Accumulating Savings and Credit Associations) and other community-based savings clubs and funds (17% of the adult population).
  • A fourth group includes all those who are financially un-served and they constitute approximately 62% of the adult population (aged 15 and over).

Interestingly, the proportions estimated for financial service access seem to strongly mirror that for mobile phones.  It is estimated that 20% of the adult population own a mobile phone, whilst 42% have access.  Thus, 58% remain without meaningful access (based on 2007 data).  This correlation between mobile phone ownership and formal sector financial service participation is also demonstrated in research conducted by Johnson & Nino-Zarazua (2007) who found that those who own a mobile phone are more likely to have a formal sector bank account by a factor of three than those who do not.  MTN’s Mobile Money subscribers account for approximately 1.4% of the 2.9 million adults that bank in the formal or semi-formal sector.  The make-up of the subscriber base is not known, but it might be assumed that all are mobile phone owners and a large proportion will already be banked.

The potential to expand the subscriber base for m-payments (and subsequently broader m-banking services such as accounts and credit) is large even among current mobile phone owners.  As the working paper suggests, though, the constraints may also be significant – particularly amongst the financially un-served.  These include:

  • Lack of financial literacy – access to post-primary education is a key factor in building financial literacy (data from 2006 suggests that only 18.1% of the population attended secondary school).  Lack of literacy skills has been mentioned as a reason for lack of use of text-based services in Uganda where only 10% of the poorest wealth quintile use SMS compared with 82% of the richest.
  • Affordability – service costs are relatively low: MTN’s Mobile Money charges as little as US40 cents per transaction; comparing favourably with services such as M-PESA in Kenya.  However, and despite strong declines, mobile usage and ownership costs remain high in Uganda.  To illustrate, consider the cost of 100 minutes of network use as a percentage of GNI (Gross National Income) per capita.  In Uganda this figure stood at 96% in 2007, compared with only 7% for South Africa.  Handsets are also far from affordable by the majority.  The extent to which the currently unbanked may be drawn into mobile phone ownership for the purpose of accessing m-payments services is likely to be highly price sensitive.  For poor households, it may depend upon whether expenditure on mobile phone services is prioritised ahead of other essential expenditure.
  • Organisational factors – for access to cash-in and cash-out facilities the services of local agents become essential.  A key issue is not just the proximity of agents to communities that wish to use the service, but also trust in the individual agent concerned, as well as trust in the technology and the financial security of the service provider.  New entrants such as mobile phone operators may be an an advantage here.  In comparison, studies reviewed in the paper report a particularly low level of trust of existing financial service providers.

Reaching the unbanked will likely require ingenuity and innovation on the behalf of service providers.  In the first instance, there is a need to more accurately define the extent of mobile phone ownership and use among this group; given that these are ever-rising.  There is also a need to understand more fully how mobile phones are used by the poor.  Evidence suggests that mobile is more likely to be used as a tool to communicate and coordinate cash transactions, rather than to deliver funds electronically.  The extent and impact of use of airtime as a currency is also unknown.

If mobile networks are to facilitate cash transfers for the poor it will be necessary to enable access to services for those who do not own phones, and to those who do not have access within their immediate vicinity.  This will require an intermediated solution and effective participation and inclusion of appropriate community-based groups in m-payments initiatives.

Beyond Subscriptions: Actual Ownership, Use and Non-Use of Mobiles in Developing Countries


As widely reported, the number of mobile phone subscribers in the world passed the four billion mark at some point around the end of 2008, in a global population of around 6.7bn of whom about 80% (5.4bn) live in developing countries.


At first sight, that might suggest that 60% (4 / 6.7) of the world’s population has a mobile phone.  Given (ITU stats) that the subscriber rate in industrialised countries is roughly 100 per 100 inhabitants, that might also suggest that 50% ((4 – 1.3) / 5.4) of those living in developing countries had a mobile phone at the start of 2009.


We arrive at similar figures if we extrapolate the ITU 2007 stats using the CAGR% for 2002-2007 (minus population growth for the per 100 inhabitants data), to get a 2008 figure:

– Africa: 409m mobile subscribers; 41 subscriptions per 100 inhabitants

– Americas minus US/Canada: 483m subscribers; 84 subscriptions per 100 inhabitants

– Asia minus Japan/S. Korea/Israel/Singapore: 1736m subscribers; 45 subscriptions per 100 inhabitants

– All developing countries: 2.63bn subscribers; 49 subscriptions per 100 inhabitants


BUT . . . These figures have a number of problems.  I summarise below what little I have found: if you know more, please comment.


Actual Ownership


First, mobile subscription figures are overestimates of in-country mobile ownership for at least four reasons (see James & Versteeg 2007, and Kalba 2008):

– Some individuals have multiple subscriptions

– Visitors (both foreigners (tourists, business visitors) and nationals who currently reside abroad) buy a subscription/card for their phone during a short-term visit

– Some people living in neighbouring countries may subscribe when they live close to the border within service range

– Subscriptions are counted for some period of days/months after the last use; some of these subscriptions may be on cards/phones that are now discarded


How big is this effect?  Of course it varies, but a gratingly rough estimate is that in-country ownership is 75% of the subscription figure.  Ewan Sutherland reports an EU-wide figure of 103 subscriptions per 100 population in 2006, but on-the-ground surveys indicating 79 per 100 own a mobile phone.  Gillwald et al report 44 subscriptions per 100 population in South Africa in 2004, but on-the-ground surveys indicated 33 per 100 mobile phone ownership.  de Silva et al (2008) surveyed in India in 2006 and found 9 mobiles owned per 100 respondents, compared to ITU data for the same period of 15 subscriptions per 100: a converter of 60%; in Sri Lanka, the converter was 85%.  Wireless Intelligence produced a report indicating real penetration as a percentage of reported penetration for 2006 was: Romania (80%); Turkey (79%); South Africa (76%).


Within the EU, the ratios vary from about 50% (wealthy Luxembourg where multiple subscriptions are very common) to roughly 100% in France.  In accession state Bulgaria, the figure was about 55%, perhaps due to it having so many foreign second home owners, nationals working overseas, and transit visitors.  So the 75% estimate covers quite a wide variation that will depend on specific national conditions.  We also need a lot more data from developing countries themselves (where there may be a fifth reason for overestimation according to James & Versteeg: those who own SIM cards but not phones).


Actual Use


Second, mobile subscription figures are underestimates of in-country mobile phone access and use for at least two reasons:

– Private mobile phones are shared with family, friends, neighbours, etc.

– Public mobile phones are accessible to large numbers of people.


How big is this effect?  James & Versteeg cite an estimate of two users on average per privately-owned mobile phone on the basis of Vodafone Tanzania data; and 70 users on average per public mobile on the basis of Grameen Phone Bangladesh data.  But they also note that levels of sharing seem to vary a lot between countries.


If we take the 75% figure and the “two users” figure, this would mean that usage rates of private mobile phones in developing countries are 1.5 times the cited subscription rates.  So, for example, that would estimate in 2008 there were around 615m private mobile phone users in Africa: about two-thirds of the population.  That’s also (citing GSM Association data) about the proportion of the population that was covered by a mobile signal.


Of course, that excludes those who use public mobiles and other public phones.  Looking at de Silva et al’s Asia data, we might estimate that in the poorer developing countries, for every mobile phone owner, there are about three others who don’t own any phone, but find a way to access and use one.  However, the figures vary wildly and the ratios decrease rapidly as mobile phone ownership rises.  It may be better to lump all phone use together and ask our final question . . .


Levels of Non-Use


Thirdly, how many people still do not use a phone?  In the 1990s, we circulated the much-quoted “fact” that half the world’s population had never made a phone call.  How do things look now?  Let us reduce the 350m in Africa who live outside cell phone coverage with Gillwald et al’s data that around 25% of rural populations in Africa had used public payphones in the past three months.  We get roughly 250m non-phoners.  About 40% of these will be under 15; we’ll exclude those, to reach 150m adult non-phoners.


In Asia, de Silva et al’s survey work from late 2006 suggested only 4.5% of adult lower-income group members in the countries they studied had not made a phone call in the previous 3 months.  That suggests 120m non-phoners.  And we might guess roughly the same proportion for Latin America, giving about 20m non-phoners there.


So, a very rough and ready estimate suggests about 300m adult non-phoners in developing countries.  This number becomes larger if we start adding in children: around 10% of the developing world’s population (some 500m) is under 5; something like a further 1.5bn are aged 5-14.  Many of them will have made phone calls, but many will not.


And Finally


Finally, some additional confusions:


– The 75% conversion from subscriptions to ownership might get messed up by age demographics.  Gillwald et al did draw from all age ranges to get their survey figures.  It’s not clear if the EU and Bulgaria figures cited by Sutherland do the same, and the de Silva et al data does not seem to have done so.  We can at least estimate that about 25% of Africa’s population and perhaps 20% of Asia’s and Latin America’s population might be seen as too young (10 or under) to own a mobile phone.  That would mean, ironically, that the mobile subscription per capita figures and the actual ownership per capita of adult populations could be about the same.


– The basis for the figures is not totally clear, but in a number of surveys (some sub-Saharan African countries covered by Gillwald et al; some Asian countries covered by de Silva et al), the reported mobile ownership per capita figures were the same, or even higher, than the ITU-reported mobile subscriber per capita figure for that country.  This may reflect the exact population from whom the survey data was gathered (e.g. more urban than the general population), but it may well also reflect just how ropey are the statistics on mobiles in developing countries, where ballpark figures and trends are all we can really talk about.


Mobiles for Impoverishment?

If you had to choose three words to sum up the future of ICT4D, they might well be “mobiles, mobiles, mobiles”.  And the way to that future is being more clearly indicated as the promise of mobiles-for-development research comes to fruition; reflected, for example, in the recent 1st “m4d” international research conference.


But such research is starting to throw up some perplexing – even worrying – findings about mobiles.  At its bluntest, such research suggests mobiles are doing more economic harm than good, and sometimes making poor people poorer.  Let’s have a look:-


a) Kurt DeMaagd’s “Pervasive versus Productive” paper analyses country-level data on mobiles and national productivity as measured by GDP.  He finds that, short-term, there is a negative association between investment in mobiles and GDP in developing countries, possibly because “mobiles represent a diversion of resources away from other productive uses”.


b) Kathleen Diga’s “Mobile Cell Phones and Poverty Reduction” dissertation (Ch.5) shows at the micro-level that some rural Ugandan households are sacrificing expenditure on purchased food (e.g. sugar, milk, flour) so they can pay for mobile airtime.  This includes households that “admit to some days of hunger in order to maintain the mobile phone”.  They are also diverting savings into mobile phone purchase and saving for airtime by foregoing attendance at social functions.


c) Hosea Mpogole, Hidaya Usanga and Matti Tedre’s “Mobile Phones and Poverty Allevation” paper at the m4d conference researches mobile use in rural Tanzania.  “48% of respondents reported that they sometimes substitute important needs (e.g. education, buying food, and clothes) for mobile phone ownership/usage”.  Modal monthly costs of mobile phone maintenance and use were US$10-20.  Mean costs were US$22.4: an average 19% of monthly income.  And, in a digital variant on the workload of water-carrying in rural Africa, many respondents were undertaking 3-7 kilometer walks 2-3 times per week in order to recharge their mobile batteries.


Very interesting research.  To which one might offer four responses.


First, I find all three pieces of research to be credible.  However, one should always mine into research methods: what exactly is being measured; exactly what questions are being asked, and what answers might respondents think they are being asked to give; what is the sample size; what assumptions are built into calculations; is the difference between correlation and causation recognised?


Second, we have research evidence of mobiles increasing incomes of the poor such as the studies on Keralan fishermen or Heather Horst and Daniel Miller’s work on mobiles in Jamaica or (from a mobiles-as-tools-of-production not tools-of-consumption perspective) studies of “umbrella people” and GrameenPhone operators.  We also have evidence of mobiles saving costs for the poor e.g. work on the informal sector in Nigeria.


Third, there is a bigger picture that this research recognises.  DeMaagd notes that, longer-term, mobile-associated GDP downticks seem to be replaced by upticks as “learning and integration with business processes” take place.  Diga echoes this macro-level explanation at the micro-level: households see short-term sacrifices as investments that will provide longer-term security and opportunity.


Fourthly, we need to explain a surprising finding in Mpogole et al’s work.  Less than 15% of mobile phone owners interviewed stated that the benefits of owning a mobile phone justified the costs.  Um . . . so if you believe that guys, why on earth do you own a mobile?


Diga’s research offers some insight but we can get much more from Harsha de Silva, Ayesha Zainudeen and Dimuthu Ratnadiwakara’s paper (earlier version as: “Teleuse on a Shoestring“) that looked at mobile use in poor communities in five Asian countries.


The most negative explanation is that mobiles represent one more step in the ingestion of the poor by the consumer society.  They are sacrificing food for (potentially economically-valueless) status and an identity of modernity, youth, urbanicity, etc that they believe mobile ownership brings.


Mobile owners may also be associating questions about financial benefits with direct, enterprise-based income generation via mobile: something that only a few achieve as yet.  They may thus set aside from their cost-benefit calculations the so-far key financial impact: savings from substitution of journey costs.


And finally, most research tells us that the poor are using mobiles for social more than business purposes.  This, again, they may set aside from their cost-benefit calculations.  Yet a) the social benefits, such as knowledge that help can be at hand in an emergency, are often highly rated when asked about directly; and b) there is no easy separation in reality of the social and the economic: social networks are often utilised by the poor to maintain or generate financial flows such as remittances or help during a crisis.


I think my overall conclusion (apart from the obvious: more research needed) would be two-fold:


– Setting aside the possibility of irrationality, the significant amounts being spent by the poor on mobiles indicate that phones have a significant value to the poor.  But that value is some rather complex mix of the financial, the economic, the psychological, the social and the symbolic.


– For some poor consumers, the financial benefits of mobiles outweigh the costs.  For some poor consumers they do not.  But we have long known (e.g. via the livelihoods framework) that “poverty” is not just about money and, hence, that poverty interventions and tools can usefully target more than just financial benefits.


What we see here, then, is not an argument to try to slam on the mobile brakes.  At most, we have an argument to invest more in sharing or building innovative uses of mobiles that are more directly connected to income generation.