Indian IT/Software Sector Statistics: 1980-2015 Time Series Data

The spreadsheet linked below provides time-series data for India’s IT industry, updating data from an earlier blog entry on Indian IT data to 2009. Software export figures run from 1980; overall IT outputs from 1991; and detailed breakdown from 1998 including BPO (business process outsourcing) data from 2000.  Data from 2009/10 uses a different source, so changes from 2008/09 to 2009/10 are not reliable.

Link to XLS version of Indian IT data via Google docs

Main headlines:

a) Indian Software Exports

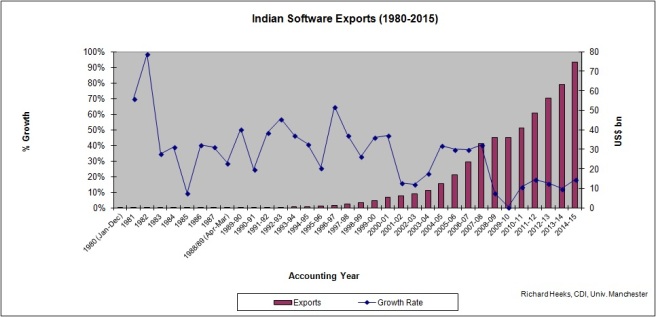
a1) Indian software exports are huge – roughly US$75bn in 2014/15 (and c.US$100bn if BPO services are included) – and continuously registering double digit annual growth.

a2) But the overall pattern of growth is slowing: the ten-year annual growth average was c.40% in 2002; c.30% in 2008; c.20% in 2014.

a3) IT software/services’ share of total exports remains roughly static: it was just under 14% in 2003/04 and just under 15% in 2013/14[1].

a4) Market diversification for Indian software remains limited.  In the early 1990s, export destinations were: US (c.60-65%), UK (c.10%), other Europe (c.10%), Aus/NZ (c.5-10%), Asia (c.0-3%)[2].  Twenty years later in 2013-14, export destinations were: North America (63%), UK (13%), other Europe (11%), Aus/NZ (4%), Asia (6%)[3].

a5) Location of production has changed.  In the early 1990s, 75% of work took place on-site, 25% in India[4].  By 2013/14, it was said that 20% of work took place on-site, 80% in India[5].  This means that net foreign exchange earnings will have risen as a proportion of gross since offshore work requires much less foreign exchange outflow than on-site working.

a6) One source[6] claims that productivity (as measured by average revenue per employee) in the Indian software sector has risen from c.US$7,000 per head in the mid-1990s, to c.US$16,000 in the late 1990s, to US$38,000 in 2014.  But my own data[7] gives a completely different picture: that productivity in the 1990s was static at just over US$30,000 per head, and thus has risen very little during the 2000s: at best by 1-2 percentage points per year.

Indian Software Exports 1980-2015

b) Domestic IT Production

b1) Although the Indian domestic IT market is large and growing, production for exports is growing faster than production for the domestic market.  As a result, the share of exports in total IT output has risen from 19% in 1991/92 to 49% in 2000/01 to 67% in 2007/08 to 81% in 2014/15.

b2) IT production for the Indian domestic market and domestic IT consumption are very different.  For example, domestic computer hardware production in 2013/14 was roughly US$3bn.  But domestic IT consumption was US$12.4bn[8].  In part, this may be because the two figures are counting different things (e.g. consumption figure includes peripherals, network kit, storage, etc).  But it likely also points to a high – and said to be growing – share of imports in Indian domestic IT consumption.

Indian IT Export Share 92-15

c) IT Sector Overall

c1) The IT sector overall in India represents just over 5% of GDP in 2014/15.

Indian IT Overall 92-15


[1] Mani, S. (2014) Emergence of India as the world leader in computer and information services, Economic & Political Weekly, XLIX(49), 51-61

[2] Heeks, R. (1996) India’s Software Industry, Sage, New Delhi

[3] ESC (2014) Computer Software/Services and ITeS Exports, Electronics and Computer Software Export Promotion Council, New Delhi www.escindia.in/uploads/SOFT1415.pdf

[4] Heeks (ibid.)

[5] RBI (2015) Survey on Computer Software & Information Technology Enabled Services Exports: 2013-14, Reserve Bank of India, New Delhi https://rbi.org.in/scripts/BS_ViewBulletin.aspx?Id=15452

[6] Malik, A. & Nilakant, V. (2015) Context and evolution of the Indian IT industry, in: Business Models and People Management in the Indian IT Industry, A. Malik & C. Rowley (eds), Routledge, Abingdon, UK, 15-34

[7] Heeks (ibid.)

[8] Chawla, M. (2014) Indian IT hardware markets stands at $12.43bn, The Economic Times, 25 Jun http://articles.economictimes.indiatimes.com/2014-06-25/news/50856134_1_anwar-shirpurwala-biswapriya-bhattacharjee-indian-it
ICT4D’s 95:5 Rule

Should we have a “95:5 rule” for ICTs and development?

Typical consumption-related uses of ICTs touch 95% of people but make only a 5% difference to their livelihoods.  This covers “intensive” application of ICTs: their use to intensify an existing livelihood.  Examples include use of mobiles to bring market information to farmers; access to e-government at a local kiosk, substituting a journey to district headquarters; use of a website helping handicraft producers sell their goods; or use of email by a retailer in a low-income community.

Typical production-related uses of ICTs touch 5% of people but make a 95% difference to their livelihood.  This covers “extensive” application of ICTs: their use to extend the range of possible livelihoods, by created a new ICT-based livelihood.  Examples include the umbrella people selling mobile phone calls by the street; or a worker from a poor community undertaking data entry work; or a mobile money service agent.  So extensive ICT livelihoods only exist because of ICT and they fall into the ICT sector, broadly defined.

95-5 Graphic

A classic example is the comparison of two studies from Kerala, India.  The arrival of mobile phones in one fishing area led to an average 9% increase in profits for fishermen[1].  Given 75% of income in South Indian fishing households comes from fishing[2], that suggests ICT consumption increased household income by 7% on average.  Simultaneous to this, the Keralan government was engaged in setting up an IT impact sourcing initiative, outsourcing data entry and digitisation work to groups of women from below-poverty-line families[3].  These new ICT jobs led to an average 75% increase in household income.

As with most quantitative findings, these specific figures don’t exactly match 5% or 95% but an overall average may get closer.

Let’s first take evidence on intensive use.  Consumption-related evidence sometimes reports more than a 5% income increase[4].  But this must be set against other work that shows a less than 5% income increase[5] or no increase[6] or questions the limited time-scales or scope of studies that demonstrate income increases[7].  And it must also be set against the occasional study showing an exact match: “Internet users reported an increase of US$ 51.86 in labor income … 5.01% per year”[8].

Can we say that 95% of those living in the global South are digital ICT consumers?  We are certainly close to that point.  There were just over 90 mobile subscriptions per 100 citizens in developing countries in 2014[9].  We need to bump that down to take account of individuals with multiple subscriptions but bump it up again to take account of shared access[10].  The end result will be in the neighbourhood of 95%.

Turning to evidence on extensive use, many of those working in the ICT sector derive 100% of their income from their employment.  We could shade that down overall given some with ICT-based livelihoods will have other income sources.  The proportion of those working in the ICT sector is growing but typically less than 5% (e.g. 5.7% of employment in OECD countries[11] but generally much lower in less-wealthy countries[12]).  As an example, India’s ICT sector represents less than 1% of India’s workforce[13] but that must be multiplied by three given the estimate that two-thirds of India’s ICT jobs lie outside the formal ICT sector[14].  But that estimate may exclude a number of ICT-based livelihoods, so the result may at least be heading for 5%.  It is certainly increasing year-on-year.

Given these pulls in various different directions, an endpoint of 95%:5% is not unreasonable, and certainly all the evidence points to some form of strong Pareto-type distribution.

So what?

Mathematically, 5% of 95% has the same development effect as 95% of 5%.  That means these two uses of ICTs should be given equal emphasis by governments, development agencies, development informatics researchers, ICT4D practitioners, etc.

But at present they are not.  Intensive, consumption-related ICT application is given far, far more attention.  In future that needs to be rectified, with equal emphasis given to digital inclusion by improving existing livelihoods; and to digital inclusion by creating new ICT-based livelihoods.

[1] Jensen, R. (2007) The digital provide: information (technology), market performance and welfare in the South Indian fishers sector, The Quarterly Journal of Economics, 122(3), 879-924

[2] Sivasubramaniam, K. (1991) Kattumaram Fisheries and Fisherfolk, FAO, Bay of Bengal Programme, Madras

[3] Heeks, R. & Arun, S. (2010) Social outsourcing as a development tool: the impact of outsourcing IT services to women’s social enterprises in Kerala, Journal of International Development, 22(4), 441-454

[4] E.g. Aker, J.C. (2008) Does Digital Divide or Provide? The Impact of Cell Phones on Grain Markets in Niger, BREAD Working Papers (177), Bureau for Research and Economic Analysis of Development, Duke University, Durham, NC; Rizvi, S.M.H. (2011) LifeLines: livelihood solutions through mobile technology in India, in: Strengthening Rural Livelihoods, D.J. Grimshaw & S. Kala (eds), Practical Action Publishing, Rugby, UK, 53-70

[5] E.g. May, J., Dutton, V. & Munyakazi, L. (2011) Information and Communication Technologies as an Escape from Poverty Traps, PICTURE Africa Research Project, Nairobi; cited in Diga, K. (2013) Access and usage of ICTs by the poor, in: Connecting ICTs to Development, L. Elder, H. Emdon, R. Fuchs & B. Petrazzini (eds), Anthem Press, London, 117-136

[6] E.g. Aker, J.C. & Fafchamps, M. (2013) Mobile Phone Coverage and Producer Markets: Evidence from West Africa, Discussion Paper 9491, Centre for Economic Policy Research, London, UK

[7] E.g. Srinivasan, J. & Burrell, J. (2013) Revisiting the fishers of Kerala, India, in:  ICTD2013: Proceedings of the Sixth International Conference on Information and Communication Technologies and Development, J. Donner & T. Parikh (eds), 56-66

[8] Galperin, H., Mariscal, J. & Barrantes, R. (2014) The Internet and Poverty: Opening the Black Box, IDRC, Ottawa

[9] ITU (2014) ICT-Eye, International Telecommunication Union, Geneva

[10] Heeks, R. (2009) Beyond subscriptions: actual ownerships, use and non-use of mobiles in developing countries, ICT4DBlog, 22 Mar

[11] OECD (2014) ICT Employment (indicator), OECD, Paris

[12] OECD (2011) Size of the ICTsector, in: OECD Factbook 2011-2012, OECD, Paris; EC (2012) Information and Communications Technology (ICT) Sector, EU Skills Panorama, European Commission, Brussels

[13] NSSO (2013) Key Indicators of Employment and Unemployment in India, 2011-2012, National Sample Survey Office, Government of India, New Delhi; Nasscom (2014) India IT-BPM Overview, Nasscom, New Delhi.

[14] Nandi, R. (2014) Decent work and low-end IT occupation workers in Delhi, The Journal of Social Science and Humanity Research, 2(1), 9-23

ICT and Economic Growth: Evidence from Kenya

Do ICTs contribute to economic growth in developing countries?

In the 1980s, Robert Solow triggered the idea of a productivity paradox, saying “You can see the computer age everywhere but in the productivity statistics.”  And for many years there was a similar developing country growth paradox: that you could increasingly see ICTs in developing countries except in the economic growth data.

That is still largely true of computers and to some extent the Internet, but much less true overall as mobiles have become the dominant form of ICTs in development.  In particular key studies such as those by Waverman et al (2005), Lee et al (2009), and Qiang (2009) have demonstrated a clear connection between mobiles and economic growth and/or between telecoms more generally and economic growth.  They all address the “endogeneity” problem: that a correlation between telecoms (indeed, all ICTs) and economic growth is readily demonstrable; but that you then have to tease out the direction of causality: economic growth of course causes increased levels of ICTs in a country (we buy more tech as we get richer); you need to try to control for that, and separate out the interesting bit: the extent to which the technology causes economic growth. 

The studies try to do this and show ICT investments cause economic growth, but they are all multi-country and provide no specific insights into the experiences of a particular developing nation.  If you know of such data, do please contribute.  Meanwhile, a recent edition of “Kenya Economic Update” provides an example.  Some overall points:

  • The ICT sector grew at an average of nearly 20% per year from 1999-2009 (by contrast, Kenya’s largest economic sector – agriculture – shrank by an annual average of nearly 2% per year).
  • The number of phone subscriptions has grown from the equivalent of one per 1,000 adults in 1999 to the equivalent of nearly one per adult in 2010; Internet usage rates for 2010 were around four per ten adults.
  • Person-to-person mobile money transactions at the end of 2010 were equivalent to around 20% of GDP with two of every three Kenyan adults being users.

But the report’s strongest claim is this: “ICT has been the main driver of Kenya’s economic growth over the last decade. … Since 2000, Kenya’s economy grew at an average of 3.7 percent. Without ICT, growth would have been a lackluster 2.8 percent—similar to the populaton growth rate—and income per capita would have stagnated”.  So ICTs were responsible for 0.9 of the 3.7% annual GDP growth, and for all of Kenya’s GDP per capita growth.  Put another way, ICTs were responsible for roughly one-quarter of Kenya’s GDP growth during the first decade of the 21st century.

Other nuggets from the report and from original World Bank data underlying the report:

  • The “ICT sector” is actually the “posts and telecommunications” sector.  Comparing figures from Research ICT Africa for mobile + fixed line + Internet/data services with those for the overall sector suggests that ICTs form by far the majority (likely greater than 90%) of that sector.  For the ICT part of the sector, latest figures for 08/09 show mobile takes a 54.8% share, fixed line takes 39.5%, with 1.8% for Internet services and 3.8% for data services (not 100% due to rounding).
  • The ICT sector in 2009 still represented only 5% of total Kenyan GDP (compared to 21% for agriculture/forestry), and growth has been volatile, at least as based on the recorded figures, ranging from 3.5% per year up to 66% per year during the first part of the decade, and from 7.9% to over 30% during the second part of the decade.  Only tourism (hotels/restaurants) was more volatile.  In six of the ten years of the 2000-2009 decade, though, ICT was Kenya’s fastest growing sector.
  • In the first half of the decade, annual investments in mobile were higher than annual revenues; but the ratio has subsequently slipped to investment averaging around half of revenue.  Investments in mobile during 2001/02 to 2009/10 are estimated at US$3.2bn (c.KSh250bn) and US$3bn in fixed phone services, with broadband, Internet and BPO investments adding perhaps another US$1bn.
  • The ICT sector provided a more than six-times-greater contribution to Kenyan GDP in 2009 compared to 1999.  Directly, the ICT sector contributed to 14% of the country’s GDP growth between 2000 and 2009 (at constant (i.e. not actual/current but accounting for inflation) prices, it grew from KSh13.7bn in 2000 to KSh71.8bn in 2009; GDP overall grew from KSh976bn to KSh1.382tn).  So the World Bank’s calculation that ICTs contributed a quarter of GDP growth during the decade also include a specific, quantified assumption about ICTs triggering growth in other sectors, in particular the financial sector.
  • Employment in the ICT sector is estimated to be around 100,000 in 2011 (c. 0.7% of the estimated 14m overall labour force).  But ICT punches above its weight in other ways: changes in mobile prices at the start of 2011 were credited with both causing the Kenyan inflation rate to drop and with potentially derailing government constitutional talks due to the substantial knock-on effects in causing tax revenues to drop since phone companies now contribute such a significant proportion of government income.

So, overall, what do we have here?  Some fairly solid evidence that ICT sector growth (predominantly due to mobiles) is making an important direct contribution to economic growth in this developing country.  And some less clear evidence that the indirect GDP growth effect of ICTs may nearly double this.  Thanks to mobile money, Kenya has seen a particularly strong take-up and economic role for ICTs, but it is fairly typical in terms of mobile investment, revenues, subscriber base, employment, etc.  In that case, it’s not too much of an extrapolation to expect that ICTs will have contributed something like one quarter of GDP growth in many developing countries during the first decade of the 21st century.  Evidence of ICT impact that development strategists and practitioners should be more aware of.

Mobile Phone Use in West Africa: Gambian Statistics

This entry reports findings from a survey of nearly 400 mobile phone users in The Gambia conducted by Fatim Badjie, who recently participated in Manchester’s MSc in ICTs for Development.

Its findings fall into six main areas:

Ownership and Costs: 83% of phone users owned their mobile; roughly 70% said that it was cheap to use a mobile.

Mobile Usage: 82% said the most-used facility on their phone was calls; 12% said it was texting; 3% said it was Internet browsing.  Overall, 38% said the service they enjoyed most was texting; 15% said Internet browsing; 8% said conference calls; 5% said video calls.  47% share their mobile with other people, sharing with an average of 3.1 other people.  That means, overall, the average mobile is used by 2.5 people (i.e. shared with 1.5 other people).  On average, users said they used their mobiles 28 times per day, and two-thirds use their mobile at least 10 times per day.

Availability and Issues: roughly 60% of users said they always had a signal and that services were available even in “inconvenient” locations (though of course Gambia is a small country).  Only 30% reported the mobile was always effective for communication and roughly one third reported they felt mobile use had become a burden to them – mostly financially but also socially or personally.  For the 55% of users who wanted improvements, these almost all related to getting 100% network coverage in the country, or wanting cheaper prices.

Impacts and Benefits: 78% felt they benefited from having a mobile particularly due to low cost of calls.  31% felt having a mobile helped them to make or get money, for example through calls from customers to go and collect money owing or, more often, calling family/friends for money (“money calls”).  58% thus felt they had come to depend on their mobile, and 78% said they could not see themselves living without one.

In terms of male-female differences:

– No real difference in rates of ownership, rates and scope of phone sharing, difficulties experienced, or dependency on mobiles.

– Slight tendency for women to have been using fixed lines rather than telecentres as a prior means of communication.

– Women use mobiles a little more than men on average per day (28.6 vs. 26.6 times).

– Less use of mobiles for Internet browsing by women than men; more use of phones for texting.

– More men (38%) than women (24%) said the mobile helped them get money and resources, though women used phones proportionately more for “money calls” than men.

My commentary would be that, overall, this is a reminder of how mature the mobile market is getting in Africa with very high rates of ownership, very high rates of usage, and signs of movement beyond basic calls/SMS: at least 15% going online via their mobiles, at least 13% using video/conference calls.  With roughly one-third saying they use mobiles to make or get money, it looks like quite a valuable financial tool: so embedded that nearly fourth-fifths of users couldn’t imagine life without it, including some who see mobiles as a “necessary burden”.

ITU estimates for 2009 (the year prior to the survey) there were 84 mobile subscriptions per 100 population in The Gambia.  Even allowing for calculations to convert from subscription data to actual ownership and use (see earlier blog entry), this means phone users were by far the bulk of the Gambian population during this survey (so skews compared to the overall population will be present but probably limited).  Given the rates of sharing reported it means that access to a mobile is virtually universal (though it must also mean that many people share their phone with others who already have one).

Noting exclusion from the survey of women (and men) who don’t use mobiles, there was relatively little difference in ownership and usage patterns between men and women.  Is that, too, a sign of market maturity?

Finally, a reminder that, even in a small country there can be significant locational differences and that “market maturity” has a rural—urban axis.  Users were surveyed in seven different parts of The Gambia but the table below compares some of the key findings for those surveyed in the capital, Banjul, and those surveyed in Bansang, a small town three-quarters of the way up-country.

  Banjul (urban) Bansang (rural)
Ownership 100% 32%
Cheap to use? 66% 84%
Access Internet via mobile 17% 0%
Use SMS texting 69% 4%
Share your mobile? 24% 86%
Average uses per day 39.8 6.7
Available in inconvenient locations? 75% 12%
Main problem (of those reporting a problem) Cost (87%) Network availability (98%)
Help you to get money/resources? 28% 40%
Calls for money 14% 44%
Live without mobile? 52% 20%

The data show some not unexpected differences.  In the rural location, there was much less ownership of mobiles and much more sharing; much less use of non-call services and generally much less daily use of the mobile.  Network availability is more of an issue in the rural area, but the mobile seems to be more useful for getting money and far fewer users in the rural area can imagine life without it.

You can access the results of the survey by clicking here: they also include more Gambia-specific questions about operators, services, and awareness of institutions.  Note the breakdown-by-location is very lengthy, and not provided in this document.

Global ICT Statistics on Internet Usage, Mobile, Broadband: 1998-2009

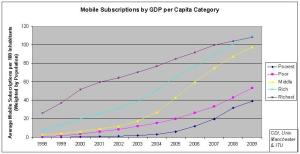
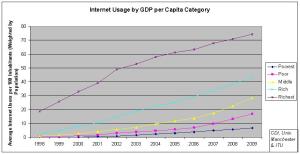
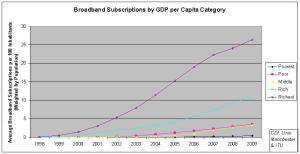
How are ICT diffusion rates changing over time in different parts of the world?  The graphs below present ITU statistics for mobile, internet and broadband, dividing countries into quintiles by GDP per capita levels, and weighting the calculated averages within each quintile by population.  They extend earlier data visualisations using Google motion chart for mobile phone and broadband penetration.

Mobile: a real sense of catch-up by the “rich” and “middle-income” countries during the mid-2000s, the former now having higher subscription rates than the “richest” countries due largely to the USA’s sub-100-per-100 statistics.  Catch-up is only just starting to happen for the poorer countries, and there’s a reminder that “mobiles are everywhere” isn’t true yet: e.g. we’ve all heard of Pakistan’s amazing growth rates but the next largest country in the bottom category is Ethiopia whose 80m citizens register less than five subscriptions per 100 people.  For fans of diffusion theory, some clear S-curve shapes on view, though a slightly worrisome dip in growth rates for the poorest countries from ’08 to ’09.  (For notes on converting mobile subscription rates to actual ownership and use rates in developing countries: see this earlier blog entry.)

Internet: still a significant gap between the richest countries and all the rest, which have a mix of larger-country stars (VietNam, China) that punch above their category averages, and dogs (South Africa, India) that fall well below.  Due to spillover effects – e.g. an Internet user passing on web-based information to a non-user – the impact of the Internet is well above what these raw figures indicate.  And poor/middle-income countries will pass the 50 users per 100 marker in just a few years.  Growth rates in the poorest countries are strong – around 25% per year – but their low base means progress is slow.

Broadband: if the Internet figures are a little salutary, then the broadband stats are more so, with the poorest countries barely figuring.  Mobiles are helping to create Development 2.0 – the ICT-enabled transformation of development processes and structures, but broadband will also be key, and it looks a very long way off for the world’s poor.  (Note poor countries average above middle-income due to China’s aggressive broadband roll-out policy, though are held back by India’s pitiful penetration rates of roughly two-thirds of a subscription per 100 people.  Middle-income countries look likely to overtake in the next year or so.)

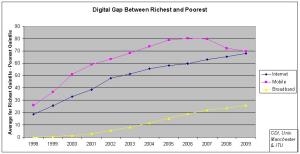
Global Digital Gap and Digital Lag

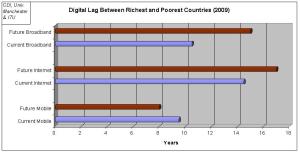
One way to summarise the situation is to look at the difference between the poorest and richest quintile countries.  As the graph shows, the “digital gap” between average penetration rates has grown and grown during the 2000s for Internet and broadband.  For mobile it began to close from 2006 onwards, but still remains very high.

You can also measure “digital lag“: the time gap between a given average ICT penetration level in the poorest countries, and the year that was achieved in the richest countries.

Current digital lag is just under 10 years for mobile, and something like 14-15 years for Internet.  For broadband, it’s just over 10 years but the figures are so low that this may not be meaningful.

Future digital lag can be calculated by projecting growth in the poorest countries, assuming current growth rates (averaged 2004-2009) continue.  For mobile, it will be 2011 before the poorest countries reach the 75 subscriptions per 100 level that the richest countries were at in 2004; a digital lag of 7 years (though that rises to 2013 and 9 years if you extrapolate from just 2008-to-2009 growth rates).

For Internet, it will be 2019 before the poorest countries reach the 50 users per 100 level that the richest countries were at in 2002; a digital lag of 17 years.  For broadband, it will be 2020 before the poorest countries reach the 15 users per 100 level that the richest countries were at in 2005; a digital lag of 15 years (but with a wide margin for error, and calculated only on 2008-to-2009 growth rates).  Put another way, there are no signs yet of the digital lag for Internet or broadband closing over time, and not much evidence for the idea that digital lag is shortening with each new ICT innovation.

I’m sure there are other conclusions to be drawn from the data – do please go ahead.  All of the original data is available from the following spreadsheet: https://docs.google.com/leaf?id=0B-14eY3gwnmGYjVkYjIxYTQtMjQxNy00OTIxLWFlN2YtNDIwZWYzYWZlZjVk&hl=en_GB [you’ll need to log in to Google in order to guarantee access]

Public Interest in ICT4D: Web Search and News Statistics

A previous blog entry on publication of ICT4D research through academic outlets suggested that the field was growing fast. In this entry, I look at ICT4D on the web and in the news, and draw some slightly more downbeat conclusions.  These must be taken with a strong pinch of salt because the data looks somewhat cronky.  But what can Google Analytics tell us about ICT4D?

As a search term “ict4d” is insufficiently used to show up in Google Trends but it will appear in Google Insights to produce the following chart and table of web search interest over time:

Year 2004 2005 2006 2007 2008 2009 2010 (part)
Average 47.7 48.4 49.5 41.3 38.9 37.3 35.8


This suggests a peak of interest in ICT4D as a search term in 2006, and a small but steady decline thereafter.  A conclusion only slightly undermined by the fact that it records 100% of searches coming from the US; and the fact that the graph was a somewhat (though not greatly) different shape when I looked at it yesterday.

In any case, Google Insights data is just relative to the recorded peak of “100”.  For a guide to absolute search levels, Google Adwords suggests a global average of 5,400 searches per month using “ict4d” during mid-2009 to mid-2010 (for all countries, in English).   (For comparison, “ictd” scores 2,900 (though a bit messed-up because ictd can mean things like “implantable cardiac therapy device”), and “development informatics” scores 1,300.)  And just in case you want to feel bad about ICT4D as your chosen field, “e-government” scores 200,000 monthly searches even though it is, like, sooo 20th century as a concept.  (A joke, by the way, just in case you were considering buying my e-Gov textbook!)  I did the same search some months back: the monthly average for 2009 alone was about half the figures shown here suggesting an increase in ICT4D search activity in 2010.

Lastly we can track ICT4D and related items recorded in Google News:

Year 2002 2003 2004 2005 2006 2007 2008 2009 2010 (est.)
“ict4d” news items 0 12 1 9 5 11 8 10 18
“ict” and “developing countries” news items 0 107 73 109 109 97 82 103 129
“broadband” and “developing countries” news items 24 42 67 76 147 119 125 125 150
“mobile” and “developing countries” news items 121 187 188 249 384 475 480 470 657


Looking at the individual news items recorded, there is some evidence of a WSIS effect creating mini-peaks in 2003 and 2005.  In general, the level of news items seems to have been fairly steady since 2006/2007 – it remains to be seen if the extrapolations for 2010 (showing a significant increase in interest) are borne out.

Overall conclusions are as follows:

– The base of data that Google Analytics provides is too small and uncertain to draw any strong conclusions.

– Since its first appearance around 2003 “ict4d” has been very useful for those in the field, but it has not really made it into the mainstream: something worth bearing in mind when trying to write for a mainstream audience.  News stories and searches more often use broader terms (as another exemplar, of the top 40 search terms used to find items on this blog, only 6 contain the term “ict4d”).

– The rapid recent rise in academic publication on ICT4D is not mirrored here.  There are some signs of a small peak of interest in the mid-2000s, but that might be exceeded in 2010, and the broader picture is one of fairly steady interest in ICT4D as a news and web search item during the latter half of the 2000s.

But maybe someone with better knowledge of Google stats will proffer some other conclusions . . .

Indian IT Sector Statistics: 1980-2009 Time Series Data

The spreadsheet linked below provides time-series data for India’s IT industry: software, hardware and services revenue for both export and domestic markets.  Software export figures run from 1980; overall IT outputs from 1991; and detailed breakdown from 1998 including BPO (business process outsourcing) data from 2000.

Link to PDF version of Indian IT Industry data with charts

Link to XLS version of Indian IT Industry data via Google Docs

Link to Google Doc spreadsheet of Indian IT Industry data

Although software and IT services tend to grab the headlines, other sub-sectors are significant: with hardware worth US$9.5bn (nearer US$12bn if one includes hardware design) and BPO worth more than US$13bn in 2008/09.  Total revenue for India’s IT industry in 2008/09 was US$73.4bn.

A number of charts are included in the PDF version.  These show, for example:

– The phenomenal growth rate of India’s software exports, with (ten-year rolling) average annual growth never dropping below 30%, and overall exports exceeding US$36bn in 2008/09:

– The much higher growth rate of Indian IT exports compared to production for the domestic market.  As a result, the share of exports in total IT output has risen from 19% in 1991/92 to 69% in 2008/09:

The source for the data used is a mixture of interviews in India and Department of Electronics/IT reports for the earlier data up to late 1990s; and the invaluable Dataquest (India) annual review of the IT industry (the “DQ Top 20”) from that point on.

Broadband Penetration Over Time: Data Visualisation with Google Motion Chart, Gapminder and Excel

I’ve entered the ITU data on broadband penetration for all countries from 1998-2008 into a Google Docs spreadsheet, and then added the Motion Chart visualiser.

To access the spreadsheet data and Google Motion chart, go to: http://spreadsheets.google.com/pub?key=tuY4rmkYVhRxKCXiltg_obg&output=html

The screenshot below gives an example. Also given below are two screenshot summary graphs derived from overview data about diffusion rates for broadband, which can be found at: http://spreadsheets.google.com/pub?key=tCyqBGWg0E8qg6qG77ltZ2g&output=html.

The most useful statistics are absolute growth rates (weighted by population), which show growth having peaked in 2005 for the richest fifth of nations, but generally still rising for the others. The percentage growth rates have been steadily declining, but mainly because those growth figures are insanely high in the first few years of broadband diffusion given the very low base they start from.

You can find similar visualisations that you can cross-match with a host of other data categories (demographics, economic/social development, and ICT diffusion) using World Bank data (http://devdata.worldbank.org/DataVisualizer/) or a graph I’ve created at Gapminder: http://bit.ly/78IWkN. But these don’t go up to 2008, and you can’t see or access the underlying data.

Note the dynamic visualisation charts will not show up on slower PCs or Internet connections.

For similar data visualisation of mobile phone penetration, see my earlier blog entry at: https://ict4dblog.wordpress.com/2009/11/30/mobile-phone-penetration-google-motion-chart-data-visualisation/

Mobile Phone Penetration: Google Motion Chart Data Visualisation

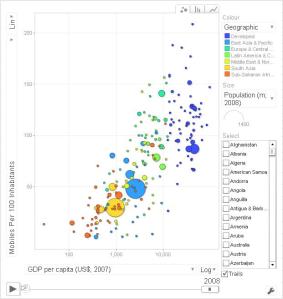
I’ve entered the ITU data on mobile phone penetration for all countries from 1998-2008 into a Google Docs spreadsheet, and then added the Motion Chart visualiser (the same engine made famous by Hans Rosling and TED, though they use the Gapminder Trendalyzer version).

Unfortunately, WordPress scripting rules mean I can’t post the active chart here. To access the spreadsheet data and Google Motion chart, you need to go to:

http://spreadsheets.google.com/pub?key=tUzZsw5SoG_jXRDl6p8tRCg&single=true&gid=0&output=html

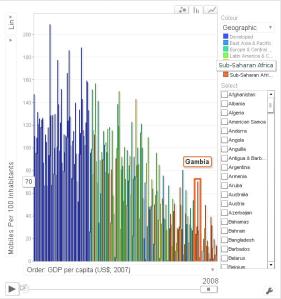
Screenshots below give an indicator of how you can visualise the data. The chart offers three main means to visualise (bubble, bar chart, and line graph) via tabs at the top right. You can change the axes and element colouring/size, and highlight individual countries. For bubble and bar, the main point of the chart is that you can click play (bottom left) and show how things change over time. (Note playback speed variation control, and also the ability to drag over and zoom in on parts of the chart.)

Not sure it adds a lot of analytic value but it’s engaging, helps give a sense of some overall trends, and identifies some interesting outliers. (Some older PCs and low-bandwidth connections will struggle to display.) I’ll repeat for other ITU data in later posts (e.g. broadband data visualisation here). You can find similar visualisation for mobile, Internet and a host of other development data at: http://devdata.worldbank.org/DataVisualizer (though currently up to 2007 only, no obvious access to underlying data, and the mobile data display doesn’t seem to work properly).  And, finally, on a separate blog entry you can find a set of rough converters to change mobile phone subscription data to data on ownership, access, use and non-use.

Worldwide Expenditure on ICT4D

How much money is spent every year on ICT4D?


We can calculate this two ways: top-down and bottom-up.


Top-Down Calculation: World Development Indicators


The World Bank’s World Development Indicators provide an entry for ICT expenditure as a % of GDP.  For 2007 – the latest year available – this expenditure was 5.93% for low- and middle-income countries (covering pretty well all those we tend to call developing and transitional economies; those with GNI per capita of less than US$11,455).  Given the GDP of those countries was US$14,155bn, that means spending on ICTs in all developing/transitional economies is estimated at US$840billion in 2007.


Of course this encompasses a very broad notion of ICT4D: as a random example, what Russian giant Gazprom spends on its information systems.  If we exclude upper middle income countries, and set the GNI bar at US$3,705 per capita (around the level of Indonesia, Philippines); then the figure drops to US$500bn.


Including just low-income countries (GNI <US$935 per capita; akin to Paul Collier’s “bottom billion”), we have to extrapolate, and get a figure of US$57bn: about US$44 spent on ICT per head.

WITSA data (see comments) seems to confirm these calculations.


[Note: “Information and communications technology expenditures include computer hardware (computers, storage devices, printers, and other peripherals); computer software (operating systems, programming tools, utilities, applications, and internal software development); computer services (information technology consulting, computer and network systems integration, Web hosting, data processing services, and other services); and communications services (voice and data communications services) and wired and wireless communications equipment.”]


Bottom-Up Calculation: Individual Organisations/Groups


A bottom-up approach would look at the ICT4D expenditure of individual organisations or groups.  We can identify four main spenders: development agencies; developing country governments; the private sector; and consumers.  Unfortunately, data here is a threadbare patchwork.


I will present the data I have available: if you have other/new data, please comment in order to update.


Donor/Development Agencies


Data from the World Bank Group shows it invests around US$800m per year in specific loans and guarantees on ICTs and development, and US$1-1.5bn per year on projects with ICT components (at present, it cites a total of nearly US$8bn invested in such projects).

Some very rough estimates from personal contacts with USAID suggest perhaps something like US$800m being spent on all ICT components of development work per year.  Even rougher estimates from JICA’s annual reports suggest it is spending at least US$200m per year, and probably significantly more.


Data from various bits of the International Telecommunication Union Web site suggests an expenditure of around US$60m per year on its development activities (c.20% of total expenditure).  The EU’s 9th European Development Fund (2000-2007; focused on Africa, Caribbean, Pacific development) included about US$20m per year (c.US$150m in total) for ICTs.  There is also expenditure on ICT4D as research collaboration under the EU’s Framework Programmes.


Canada’s IDRC spends 15.8% of its budget on ICT4D; that budget spending was C$190m in 2008, meaning a total spend of around US$25m per year on ICT4D.  Korea’s International Cooperation Agency seems also to spend around US$25m per year on ICT4D; about 13% of budget.


SIDA appears to be spending around US$3m per year on ICT4D.


Delivery agencies with a specific focus on ICT4D have similarly small budgets, and will not make a significant dent on the overall figures.  Examples would include IICD which spends around US$6m per year, and the Global Knowledge Partnership which may spend about half that.  Quite a bit of this money would come from donor agency funds.


Developing Country Governments


Few if any developing country governments appear to compile comprehensive figures on their ICT investments.  Instead, they quote expenditure that is specifically identified as “ICT”; for example, the budget of the Ministry of ICT.  This will probably exclude the majority of what the government spends on ICT.  For example, Ghana seems to budget ICT spending on health and education under health and education respectively, not under ICT.


Quoted annual government expenditures on ICTs via this narrow definition for some “typical” medium-/large-sized developing countries are in the few hundreds of millions of dollars.  E.g. Indonesia (US$340m); Thailand (US$300m); South Africa (US$130m).  These are about 0.5% of total government budget; and just under 0.1% of total GDP.


Extrapolating that latter figure, for low and lower-middle income countries, that would suggest investments of about US$7.5bn per year, but the actual figure must be significantly higher than this.  As one example, the Indian government in the mid-2000s was already in the process of increasing its total spending on ICTs (i.e. not just that specifically allocated to the ICT heading) from 2% to 3% of budget: a figure of around US$3bn.  By comparison, its direct spending on ICT (mostly allocated to e-government) was around one-tenth of this.


Private Sector


Private sector investment levels in mobile telephony are, according to the GSMA, around US$10bn per year in Africa; very roughly US$10 per capita.  If at least that amount is also spent in the other developing country markets, that suggests a total investment per year of at least US$50bn.


Other ICT investments in computers, software, non-mobile-based Internet connectivity, and so forth, would be in addition to this figure.


The private sector also has specific development-oriented activities.  Examples would be Microsoft Research India, and parts of Microsoft’s Unlimited Potential programme, or Intel’s World Ahead.


Consumer Expenditure


Individual consumers spend money on ICTs that are part of ICT4D; for example, the amount they spend on mobile telephony, and on use of telecentres.


Extrapolating figures from Nigeria, which suggest an average per capita spend on all telecommunications of US$55 per year, would indicate spending of around US$55bn per year on telecoms in Africa.  Much of that, of course, would be spent by business rather than individuals, and that money then recirculates for further private sector investment.  If those same figures could be extrapolated across all developing countries, they would suggest a spend of around US$300bn per year, but that is likely a significant underestimate since Nigerian expenditure will be below developing country averages.  That US$55 per year is actually MORE than the US$44 figure indicated from the World Development Indicator figures, and yet it only covers telecommunications.


Alternatively, Mpogole’s work in Tanzania found rural mobile phone owners spending around US$22 per month (US$270 per year) on their mobiles.  Using ITU’s 2007 figures (21% subscription rate) and the corrector discussed in a previous blog, we arrive at a spend just on mobiles of US$43 per person per year.  At least, then, all these figures are not wildly dissimilar, given that spending on mobiles will be by far the major expenditure on ICT4D in developing countries.


Conclusion


The figures here cover some very different things.  Some cover a lot of what many would regard as outside the boundaries of ICT4D.  Nonetheless, it seems reasonable to conclude that hundreds of millions of US dollars per year are invested in ICT4D projects; and that tens of billions of US dollars per year are invested in ICT4D infrastructure, with consumers in developing countries spending even more on the use of ICTs, amounting on average to a few tens of US dollars per person per year.


As noted above, additions and updates are welcome.


Note: the SIDA source cited above contains, in its Chapter 4, a quick review of some of the main actors investing in ICT4D.